		4800755


		1
		apa
		50
		date
		desc
		year


		1
		1


        523
		https://geohealthresearch.org/wp-content/plugins/zotpress/


				%7B%22status%22%3A%22success%22%2C%22updateneeded%22%3Afalse%2C%22instance%22%3Afalse%2C%22meta%22%3A%7B%22request_last%22%3A50%2C%22request_next%22%3A50%2C%22used_cache%22%3Atrue%7D%2C%22data%22%3A%5B%7B%22key%22%3A%222AFI4IML%22%2C%22library%22%3A%7B%22id%22%3A4800755%7D%2C%22meta%22%3A%7B%22creatorSummary%22%3A%22Chaumeau%20et%20al.%22%2C%22parsedDate%22%3A%222025-12-29%22%2C%22numChildren%22%3A0%7D%2C%22bib%22%3A%22%26lt%3Bdiv%20class%3D%26quot%3Bcsl-bib-body%26quot%3B%20style%3D%26quot%3Bline-height%3A%202%3B%20padding-left%3A%201em%3B%20text-indent%3A-1em%3B%26quot%3B%26gt%3B%5Cn%20%20%26lt%3Bdiv%20class%3D%26quot%3Bcsl-entry%26quot%3B%26gt%3BChaumeau%2C%20V.%2C%20Kularbkeeree%2C%20T.%2C%20Gloria%2C%20N.%2C%20Jaruwan%2C%20N.%2C%20Sawasdichai%2C%20S.%2C%20Pateekhum%2C%20C.%2C%20Girond%2C%20F.%2C%20Herbreteau%2C%20V.%2C%20%26amp%3B%20Nosten%2C%20F.%20%282025%29.%20Assessment%20of%20mosquito%20species%20communities%20biting%20humans%20and%20their%20livestock%20in%20the%20forest%20hills%20of%20Karen%20state%2C%20Myanmar%3A%20a%20cross-sectional%20survey%20in%20six%20villages.%20%26lt%3Bi%26gt%3BParasites%20%26amp%3B%20Vectors%26lt%3B%5C%2Fi%26gt%3B.%20%26lt%3Ba%20class%3D%26%23039%3Bzp-DOIURL%26%23039%3B%20target%3D%26%23039%3B_blank%26%23039%3B%20href%3D%26%23039%3Bhttps%3A%5C%2F%5C%2Fdoi.org%5C%2F10.1186%5C%2Fs13071-025-07217-9%26%23039%3B%26gt%3Bhttps%3A%5C%2F%5C%2Fdoi.org%5C%2F10.1186%5C%2Fs13071-025-07217-9%26lt%3B%5C%2Fa%26gt%3B%20%26lt%3Ba%20title%3D%26%23039%3BCite%20in%20RIS%20Format%26%23039%3B%20class%3D%26%23039%3Bzp-CiteRIS%26%23039%3B%20data-zp-cite%3D%26%23039%3Bapi_user_id%3D4800755%26amp%3Bitem_key%3D2AFI4IML%26%23039%3B%20href%3D%26%23039%3Bjavascript%3Avoid%280%29%3B%26%23039%3B%26gt%3BCite%26lt%3B%5C%2Fa%26gt%3B%20%26lt%3B%5C%2Fdiv%26gt%3B%5Cn%26lt%3B%5C%2Fdiv%26gt%3B%22%2C%22data%22%3A%7B%22itemType%22%3A%22journalArticle%22%2C%22title%22%3A%22Assessment%20of%20mosquito%20species%20communities%20biting%20humans%20and%20their%20livestock%20in%20the%20forest%20hills%20of%20Karen%20state%2C%20Myanmar%3A%20a%20cross-sectional%20survey%20in%20six%20villages%22%2C%22creators%22%3A%5B%7B%22creatorType%22%3A%22author%22%2C%22firstName%22%3A%22Victor%22%2C%22lastName%22%3A%22Chaumeau%22%7D%2C%7B%22creatorType%22%3A%22author%22%2C%22firstName%22%3A%22Thithiwarada%22%2C%22lastName%22%3A%22Kularbkeeree%22%7D%2C%7B%22creatorType%22%3A%22author%22%2C%22firstName%22%3A%22Naw%22%2C%22lastName%22%3A%22Gloria%22%7D%2C%7B%22creatorType%22%3A%22author%22%2C%22firstName%22%3A%22Naw%22%2C%22lastName%22%3A%22Jaruwan%22%7D%2C%7B%22creatorType%22%3A%22author%22%2C%22firstName%22%3A%22Sunisa%22%2C%22lastName%22%3A%22Sawasdichai%22%7D%2C%7B%22creatorType%22%3A%22author%22%2C%22firstName%22%3A%22Chanapat%22%2C%22lastName%22%3A%22Pateekhum%22%7D%2C%7B%22creatorType%22%3A%22author%22%2C%22firstName%22%3A%22Florian%22%2C%22lastName%22%3A%22Girond%22%7D%2C%7B%22creatorType%22%3A%22author%22%2C%22firstName%22%3A%22Vincent%22%2C%22lastName%22%3A%22Herbreteau%22%7D%2C%7B%22creatorType%22%3A%22author%22%2C%22firstName%22%3A%22Fran%5Cu00e7ois%22%2C%22lastName%22%3A%22Nosten%22%7D%5D%2C%22abstractNote%22%3A%22Abstract%5Cn%20%20%20%20%20%20%20%20%20%20%20%20%5Cn%20%20%20%20%20%20%20%20%20%20%20%20%20%20Background%5Cn%20%20%20%20%20%20%20%20%20%20%20%20%20%20Mosquito-borne%20diseases%20cause%20significant%20burdens%20in%20rural%20areas%20of%20Southeast%20Asia.%20The%20lack%20of%20data%20on%20vector%20bionomics%20hinders%20disease%20control%20and%20elimination.%20The%20objectives%20of%20this%20study%20were%20to%20assess%20the%20diversity%20and%20biting%20behaviours%20of%20mosquito%20species%20biting%20humans%20and%20their%20livestock%20in%20the%20forest%20hills%20of%20Karen%20state%2C%20Myanmar%2C%20and%20to%20assess%20the%20patterns%20of%20species%20co-occurrence%20and%20the%20effects%20of%20the%20environment%20on%20vector%20abundance.%5Cn%20%20%20%20%20%20%20%20%20%20%20%20%5Cn%20%20%20%20%20%20%20%20%20%20%20%20%5Cn%20%20%20%20%20%20%20%20%20%20%20%20%20%20Methods%5Cn%20%20%20%20%20%20%20%20%20%20%20%20%20%20Mosquitoes%20were%20captured%20over%2024-h%20diel%20cycles%20in%20six%20villages%20in%20September%202019%20using%20the%20human%20landing%20catch%20and%20cow-baited%20trap%20collection%20methods.%20Collected%20specimens%20were%20identified%20to%20the%20species%20level%20using%20dichotomous%20morphological%20keys.%20Environmental%20data%20were%20acquired%20through%20remote%20sensing.%20The%20analysis%20of%20biting%20times%20was%20performed%20with%20circular%20statistics.%20Species%20co-occurrence%20patterns%20and%20the%20effects%20of%20environmental%20variables%20on%20species%20abundance%20were%20assessed%20with%20a%20generalized%20linear%20latent%20variable%20model.%5Cn%20%20%20%20%20%20%20%20%20%20%20%20%5Cn%20%20%20%20%20%20%20%20%20%20%20%20%5Cn%20%20%20%20%20%20%20%20%20%20%20%20%20%20Results%5Cn%20%20%20%20%20%20%20%20%20%20%20%20%20%20%5Cn%20%20%20%20%20%20%20%20%20%20%20%20%20%20%20%20A%20total%20of%2036%2C607%20mosquitoes%20were%20captured%2C%20and%2096%20species%20in%2016%20genera%20were%20identified.%20The%20most%20abundant%20genera%20were%5Cn%20%20%20%20%20%20%20%20%20%20%20%20%20%20%20%20Anopheles%5Cn%20%20%20%20%20%20%20%20%20%20%20%20%20%20%20%20%2C%5Cn%20%20%20%20%20%20%20%20%20%20%20%20%20%20%20%20Culex%5Cn%20%20%20%20%20%20%20%20%20%20%20%20%20%20%20%20and%5Cn%20%20%20%20%20%20%20%20%20%20%20%20%20%20%20%20Downsiomyia%5Cn%20%20%20%20%20%20%20%20%20%20%20%20%20%20%20%20.%20Multiple%20malaria%2C%20arboviruses%20and%20lymphatic%20filariasis%20vector%20species%20were%20detected%2C%20and%20their%20biting%20behaviours%20were%20reported.%20Generalized%20linear%20latent%20variable%20modelling%20revealed%20two%20clusters%20of%20species%20that%20were%20positively%20correlated%20with%20one%20another.%20The%20first%20cluster%20included%20many%5Cn%20%20%20%20%20%20%20%20%20%20%20%20%20%20%20%20Culex%5Cn%20%20%20%20%20%20%20%20%20%20%20%20%20%20%20%20and%5Cn%20%20%20%20%20%20%20%20%20%20%20%20%20%20%20%20Anopheles%5Cn%20%20%20%20%20%20%20%20%20%20%20%20%20%20%20%20species%2C%20and%5Cn%20%20%20%20%20%20%20%20%20%20%20%20%20%20%20%20Mansonia%20annulata%5Cn%20%20%20%20%20%20%20%20%20%20%20%20%20%20%20%20%2C%20which%20breed%20in%20shallow%2C%20stagnant%20or%20slow-moving%20water%2C%20such%20as%20marshes%2C%20swamps%2C%20rice%20fields%20and%20the%20margins%20of%20streams%20and%20puddles.%20These%20species%20were%20negatively%20associated%20with%20elevation%2C%20slopes%20and%20%20forests%20and%20positively%20associated%20with%20grasslands%2C%20shrubs%20and%20crop%20fields.%20The%20second%20cluster%20included%20many%20rainforest%20mosquitoes%20of%20the%20genera%5Cn%20%20%20%20%20%20%20%20%20%20%20%20%20%20%20%20Armigeres%5Cn%20%20%20%20%20%20%20%20%20%20%20%20%20%20%20%20%2C%5Cn%20%20%20%20%20%20%20%20%20%20%20%20%20%20%20%20Heizmannia%5Cn%20%20%20%20%20%20%20%20%20%20%20%20%20%20%20%20%2C%5Cn%20%20%20%20%20%20%20%20%20%20%20%20%20%20%20%20Downsiomyia%5Cn%20%20%20%20%20%20%20%20%20%20%20%20%20%20%20%20%2C%5Cn%20%20%20%20%20%20%20%20%20%20%20%20%20%20%20%20Anopheles%20dirus%5Cn%20%20%20%20%20%20%20%20%20%20%20%20%20%20%20%20%2C%5Cn%20%20%20%20%20%20%20%20%20%20%20%20%20%20%20%20An.%20jeyporiensis%5Cn%20%20%20%20%20%20%20%20%20%20%20%20%20%20%20%20%2C%5Cn%20%20%20%20%20%20%20%20%20%20%20%20%20%20%20%20Culex%20bitaeniorhynchus%5Cn%20%20%20%20%20%20%20%20%20%20%20%20%20%20%20%20and%5Cn%20%20%20%20%20%20%20%20%20%20%20%20%20%20%20%20Aedes%20pseudoalbopictus%5Cn%20%20%20%20%20%20%20%20%20%20%20%20%20%20%20%20%2C%20which%20breed%20in%20tree%20canopies%20and%20in%20natural%20surface%20water%20and%20containers%20such%20as%20bamboo%20stumps%2C%20tree%20holes%20and%20rainwater%20pools.%20These%20species%20were%20positively%20associated%20with%20elevation%2C%20slope%2C%20dense%20forests%2C%20surface%20water%20and%20wetlands%20and%20negatively%20associated%20with%20crop%20fields%2C%20grasslands%20and%20shrubs.%5Cn%20%20%20%20%20%20%20%20%20%20%20%20%20%20%5Cn%20%20%20%20%20%20%20%20%20%20%20%20%5Cn%20%20%20%20%20%20%20%20%20%20%20%20%5Cn%20%20%20%20%20%20%20%20%20%20%20%20%20%20Conclusions%5Cn%20%20%20%20%20%20%20%20%20%20%20%20%20%20Transmission%20dynamics%20are%20particularly%20complex%20in%20this%20setting%20where%20people%20are%20exposed%20to%20bites%20of%20numerous%20vector%20species%20throughout%20the%20diel%20cycle.%20Environmental%20factors%20shape%20the%20assembly%20of%20mosquito%20species%20communities%20and%20largely%20determine%20the%20risk%20of%20exposure%20to%20vector%20bites.%5Cn%20%20%20%20%20%20%20%20%20%20%20%20%5Cn%20%20%20%20%20%20%20%20%20%20%20%20%5Cn%20%20%20%20%20%20%20%20%20%20%20%20%20%20Graphical%20abstract%22%2C%22date%22%3A%222025-12-29%22%2C%22section%22%3A%22%22%2C%22partNumber%22%3A%22%22%2C%22partTitle%22%3A%22%22%2C%22DOI%22%3A%2210.1186%5C%2Fs13071-025-07217-9%22%2C%22citationKey%22%3A%22%22%2C%22url%22%3A%22https%3A%5C%2F%5C%2Flink.springer.com%5C%2F10.1186%5C%2Fs13071-025-07217-9%22%2C%22PMID%22%3A%22%22%2C%22PMCID%22%3A%22%22%2C%22ISSN%22%3A%221756-3305%22%2C%22language%22%3A%22en%22%2C%22collections%22%3A%5B%5D%2C%22dateModified%22%3A%222026-01-05T04%3A20%3A32Z%22%7D%7D%2C%7B%22key%22%3A%226YADA2ED%22%2C%22library%22%3A%7B%22id%22%3A4800755%7D%2C%22meta%22%3A%7B%22creatorSummary%22%3A%22Herbreteau%20et%20al.%22%2C%22parsedDate%22%3A%222025-10-29%22%2C%22numChildren%22%3A0%7D%2C%22bib%22%3A%22%26lt%3Bdiv%20class%3D%26quot%3Bcsl-bib-body%26quot%3B%20style%3D%26quot%3Bline-height%3A%202%3B%20padding-left%3A%201em%3B%20text-indent%3A-1em%3B%26quot%3B%26gt%3B%5Cn%20%20%26lt%3Bdiv%20class%3D%26quot%3Bcsl-entry%26quot%3B%26gt%3BHerbreteau%2C%20V.%2C%20Maquart%2C%20P.-O.%2C%20Hoeun%2C%20S.%2C%20Doeurk%2C%20B.%2C%20Girond%2C%20F.%2C%20%26amp%3B%20Boyer%2C%20S.%20%282025%29.%20Spatio-temporal%20distribution%20and%20environmental%20determinants%20of%20dengue%20vectors%20in%20Phnom%20Penh%2C%20Cambodia.%20%26lt%3Bi%26gt%3BPLOS%20Neglected%20Tropical%20Diseases%26lt%3B%5C%2Fi%26gt%3B%2C%20%26lt%3Bi%26gt%3B19%26lt%3B%5C%2Fi%26gt%3B%2810%29%2C%20e0013667.%20%26lt%3Ba%20class%3D%26%23039%3Bzp-DOIURL%26%23039%3B%20target%3D%26%23039%3B_blank%26%23039%3B%20href%3D%26%23039%3Bhttps%3A%5C%2F%5C%2Fdoi.org%5C%2F10.1371%5C%2Fjournal.pntd.0013667%26%23039%3B%26gt%3Bhttps%3A%5C%2F%5C%2Fdoi.org%5C%2F10.1371%5C%2Fjournal.pntd.0013667%26lt%3B%5C%2Fa%26gt%3B%20%26lt%3Ba%20title%3D%26%23039%3BCite%20in%20RIS%20Format%26%23039%3B%20class%3D%26%23039%3Bzp-CiteRIS%26%23039%3B%20data-zp-cite%3D%26%23039%3Bapi_user_id%3D4800755%26amp%3Bitem_key%3D6YADA2ED%26%23039%3B%20href%3D%26%23039%3Bjavascript%3Avoid%280%29%3B%26%23039%3B%26gt%3BCite%26lt%3B%5C%2Fa%26gt%3B%20%26lt%3B%5C%2Fdiv%26gt%3B%5Cn%26lt%3B%5C%2Fdiv%26gt%3B%22%2C%22data%22%3A%7B%22itemType%22%3A%22journalArticle%22%2C%22title%22%3A%22Spatio-temporal%20distribution%20and%20environmental%20determinants%20of%20dengue%20vectors%20in%20Phnom%20Penh%2C%20Cambodia%22%2C%22creators%22%3A%5B%7B%22creatorType%22%3A%22author%22%2C%22firstName%22%3A%22Vincent%22%2C%22lastName%22%3A%22Herbreteau%22%7D%2C%7B%22creatorType%22%3A%22author%22%2C%22firstName%22%3A%22Pierre-Olivier%22%2C%22lastName%22%3A%22Maquart%22%7D%2C%7B%22creatorType%22%3A%22author%22%2C%22firstName%22%3A%22Sokeang%22%2C%22lastName%22%3A%22Hoeun%22%7D%2C%7B%22creatorType%22%3A%22author%22%2C%22firstName%22%3A%22Bros%22%2C%22lastName%22%3A%22Doeurk%22%7D%2C%7B%22creatorType%22%3A%22author%22%2C%22firstName%22%3A%22Florian%22%2C%22lastName%22%3A%22Girond%22%7D%2C%7B%22creatorType%22%3A%22author%22%2C%22firstName%22%3A%22S%5Cu00e9bastien%22%2C%22lastName%22%3A%22Boyer%22%7D%2C%7B%22creatorType%22%3A%22editor%22%2C%22firstName%22%3A%22Rafael%22%2C%22lastName%22%3A%22Maciel-de-Freitas%22%7D%5D%2C%22abstractNote%22%3A%22Dengue%20fever%2C%20one%20of%20the%20most%20widespread%20vector-borne%20diseases%20globally%2C%20is%20mainly%20transmitted%20by%5Cn%20%20%20%20%20%20%20%20%20%20%20%20%20%20Aedes%20aegypti%5Cn%20%20%20%20%20%20%20%20%20%20%20%20%20%20and%5Cn%20%20%20%20%20%20%20%20%20%20%20%20%20%20Ae.%20albopictus%5Cn%20%20%20%20%20%20%20%20%20%20%20%20%20%20mosquitoes.%20In%20Cambodia%2C%20dengue%20has%20been%20a%20recurrent%20public%20health%20challenge%2C%20with%20major%20outbreaks%20occurring%20in%201995%2C%202007%2C%202012%2C%20and%202019.%20The%20latter%20epidemic%20severely%20impacted%20the%20capital%2C%20Phnom%20Penh%2C%20yet%20the%20spatial%20and%20temporal%20dynamics%20of%20the%20two%20key%20vector%20species%20had%20not%20been%20studied%20in%20this%20urban%20context.%20This%20study%20aimed%20to%20investigate%20how%20the%20distribution%20of%5Cn%20%20%20%20%20%20%20%20%20%20%20%20%20%20Ae.%20aegypti%5Cn%20%20%20%20%20%20%20%20%20%20%20%20%20%20and%5Cn%20%20%20%20%20%20%20%20%20%20%20%20%20%20Ae.%20albopictus%5Cn%20%20%20%20%20%20%20%20%20%20%20%20%20%20is%20organized%20in%20the%20urban%20and%20peri-urban%20landscapes%20of%20Phnom%20Penh.%20Ovitraps%20were%20deployed%20every%20two%20months%20over%20a%20year%20in%2040%20pagodas%20randomly%20selected%20across%20Phnom%20Penh%2C%20chosen%20to%20ensure%20future%20replicability%20of%20the%20study.%20The%20larvae%20collected%20were%20reared%20to%20adulthood%20for%20accurate%20species%20identification.%20High-resolution%20satellite%20imagery%20%28SPOT7%29%20and%20daily%20rainfall%20data%20were%20used%20to%20analyze%20the%20surrounding%20environments%20through%20remote%20sensing%20techniques.%20The%20results%20revealed%20distinct%20spatio-temporal%20patterns%20for%20each%20species%3A%5Cn%20%20%20%20%20%20%20%20%20%20%20%20%20%20Ae.%20albopictus%5Cn%20%20%20%20%20%20%20%20%20%20%20%20%20%20was%20associated%20with%20peri-urban%20areas%20rich%20in%20vegetation%20and%20water%2C%20while%5Cn%20%20%20%20%20%20%20%20%20%20%20%20%20%20Ae.%20aegypti%5Cn%20%20%20%20%20%20%20%20%20%20%20%20%20%20predominated%20in%20highly%20urbanized%20and%20construction-dense%20environments.%20Spatial%20analysis%20using%20buffer%20zones%20%28250%20m%2C%20500%20m%2C%201000%20m%29%20around%20trapping%20sites%20confirmed%20that%20the%20use%20of%20pagodas%20as%20proxies%20for%20urban%20sampling%20is%20effective.%20These%20findings%20highlight%20the%20importance%20of%20monitoring%20these%20vector%20species%2C%20particularly%20as%20Phnom%20Penh%20continues%20to%20undergo%20rapid%20environmental%20transformation.%20The%20identification%20of%20simple%2C%20remotely%20sensed%20environmental%20indicators%20offer%20a%20valuable%20tool%20for%20predicting%20future%20outbreaks%20and%20guiding%20targeted%20vector%20control%20strategies.%20This%20study%20also%20provides%20a%20replicable%20methodological%20framework%20to%20assess%20the%20impact%20of%20urbanization%20and%20climate%20change%20on%20dengue%20vector%20distribution%20in%20Phnom%20Penh%20and%20similar%20urban%20settings.%22%2C%22date%22%3A%222025-10-29%22%2C%22section%22%3A%22%22%2C%22partNumber%22%3A%22%22%2C%22partTitle%22%3A%22%22%2C%22DOI%22%3A%2210.1371%5C%2Fjournal.pntd.0013667%22%2C%22citationKey%22%3A%22%22%2C%22url%22%3A%22https%3A%5C%2F%5C%2Fdx.plos.org%5C%2F10.1371%5C%2Fjournal.pntd.0013667%22%2C%22PMID%22%3A%22%22%2C%22PMCID%22%3A%22%22%2C%22ISSN%22%3A%221935-2735%22%2C%22language%22%3A%22en%22%2C%22collections%22%3A%5B%5D%2C%22dateModified%22%3A%222025-11-11T16%3A48%3A08Z%22%7D%7D%2C%7B%22key%22%3A%22A4T4KVYU%22%2C%22library%22%3A%7B%22id%22%3A4800755%7D%2C%22meta%22%3A%7B%22creatorSummary%22%3A%22Kliengchuay%20et%20al.%22%2C%22parsedDate%22%3A%222025-07-30%22%2C%22numChildren%22%3A0%7D%2C%22bib%22%3A%22%26lt%3Bdiv%20class%3D%26quot%3Bcsl-bib-body%26quot%3B%20style%3D%26quot%3Bline-height%3A%202%3B%20padding-left%3A%201em%3B%20text-indent%3A-1em%3B%26quot%3B%26gt%3B%5Cn%20%20%26lt%3Bdiv%20class%3D%26quot%3Bcsl-entry%26quot%3B%26gt%3BKliengchuay%2C%20W.%2C%20Phonphan%2C%20W.%2C%20Niampradit%2C%20S.%2C%20Kiangkoo%2C%20N.%2C%20Srimanus%2C%20W.%2C%20Niemmanee%2C%20T.%2C%20Arunplod%2C%20C.%2C%20Wen%2C%20B.%2C%20Guo%2C%20Y.%2C%20Herbreteau%2C%20V.%2C%20%26amp%3B%20Tantrakarnapa%2C%20K.%20%282025%29.%20Variation%20of%20vegetation%20cover%20and%20the%20relationship%20with%20land%20surface%20temperature%20across%20Thailand%20%282007%20to%202022%29.%20%26lt%3Bi%26gt%3BScientific%20Reports%26lt%3B%5C%2Fi%26gt%3B%2C%20%26lt%3Bi%26gt%3B15%26lt%3B%5C%2Fi%26gt%3B%281%29%2C%2027823.%20%26lt%3Ba%20class%3D%26%23039%3Bzp-DOIURL%26%23039%3B%20target%3D%26%23039%3B_blank%26%23039%3B%20href%3D%26%23039%3Bhttps%3A%5C%2F%5C%2Fdoi.org%5C%2F10.1038%5C%2Fs41598-025-13018-y%26%23039%3B%26gt%3Bhttps%3A%5C%2F%5C%2Fdoi.org%5C%2F10.1038%5C%2Fs41598-025-13018-y%26lt%3B%5C%2Fa%26gt%3B%20%26lt%3Ba%20title%3D%26%23039%3BCite%20in%20RIS%20Format%26%23039%3B%20class%3D%26%23039%3Bzp-CiteRIS%26%23039%3B%20data-zp-cite%3D%26%23039%3Bapi_user_id%3D4800755%26amp%3Bitem_key%3DA4T4KVYU%26%23039%3B%20href%3D%26%23039%3Bjavascript%3Avoid%280%29%3B%26%23039%3B%26gt%3BCite%26lt%3B%5C%2Fa%26gt%3B%20%26lt%3B%5C%2Fdiv%26gt%3B%5Cn%26lt%3B%5C%2Fdiv%26gt%3B%22%2C%22data%22%3A%7B%22itemType%22%3A%22journalArticle%22%2C%22title%22%3A%22Variation%20of%20vegetation%20cover%20and%20the%20relationship%20with%20land%20surface%20temperature%20across%20Thailand%20%282007%20to%202022%29%22%2C%22creators%22%3A%5B%7B%22creatorType%22%3A%22author%22%2C%22firstName%22%3A%22Wissanupong%22%2C%22lastName%22%3A%22Kliengchuay%22%7D%2C%7B%22creatorType%22%3A%22author%22%2C%22firstName%22%3A%22Walaiporn%22%2C%22lastName%22%3A%22Phonphan%22%7D%2C%7B%22creatorType%22%3A%22author%22%2C%22firstName%22%3A%22Sarima%22%2C%22lastName%22%3A%22Niampradit%22%7D%2C%7B%22creatorType%22%3A%22author%22%2C%22firstName%22%3A%22Nuttapohn%22%2C%22lastName%22%3A%22Kiangkoo%22%7D%2C%7B%22creatorType%22%3A%22author%22%2C%22firstName%22%3A%22Wechapraan%22%2C%22lastName%22%3A%22Srimanus%22%7D%2C%7B%22creatorType%22%3A%22author%22%2C%22firstName%22%3A%22Talisa%22%2C%22lastName%22%3A%22Niemmanee%22%7D%2C%7B%22creatorType%22%3A%22author%22%2C%22firstName%22%3A%22Chomchanok%22%2C%22lastName%22%3A%22Arunplod%22%7D%2C%7B%22creatorType%22%3A%22author%22%2C%22firstName%22%3A%22Bo%22%2C%22lastName%22%3A%22Wen%22%7D%2C%7B%22creatorType%22%3A%22author%22%2C%22firstName%22%3A%22Yuming%22%2C%22lastName%22%3A%22Guo%22%7D%2C%7B%22creatorType%22%3A%22author%22%2C%22firstName%22%3A%22Vincent%22%2C%22lastName%22%3A%22Herbreteau%22%7D%2C%7B%22creatorType%22%3A%22author%22%2C%22firstName%22%3A%22Kraichat%22%2C%22lastName%22%3A%22Tantrakarnapa%22%7D%5D%2C%22abstractNote%22%3A%22%22%2C%22date%22%3A%222025-07-30%22%2C%22section%22%3A%22%22%2C%22partNumber%22%3A%22%22%2C%22partTitle%22%3A%22%22%2C%22DOI%22%3A%2210.1038%5C%2Fs41598-025-13018-y%22%2C%22citationKey%22%3A%22%22%2C%22url%22%3A%22https%3A%5C%2F%5C%2Fwww.nature.com%5C%2Farticles%5C%2Fs41598-025-13018-y%22%2C%22PMID%22%3A%22%22%2C%22PMCID%22%3A%22%22%2C%22ISSN%22%3A%222045-2322%22%2C%22language%22%3A%22en%22%2C%22collections%22%3A%5B%5D%2C%22dateModified%22%3A%222025-10-28T21%3A27%3A14Z%22%7D%7D%2C%7B%22key%22%3A%22B6QC8VC7%22%2C%22library%22%3A%7B%22id%22%3A4800755%7D%2C%22meta%22%3A%7B%22creatorSummary%22%3A%22Randriamihaja%20et%20al.%22%2C%22parsedDate%22%3A%222025-04-01%22%2C%22numChildren%22%3A0%7D%2C%22bib%22%3A%22%26lt%3Bdiv%20class%3D%26quot%3Bcsl-bib-body%26quot%3B%20style%3D%26quot%3Bline-height%3A%202%3B%20padding-left%3A%201em%3B%20text-indent%3A-1em%3B%26quot%3B%26gt%3B%5Cn%20%20%26lt%3Bdiv%20class%3D%26quot%3Bcsl-entry%26quot%3B%26gt%3BRandriamihaja%2C%20M.%2C%20Randrianjatovo%2C%20T.%20M.%2C%20Evans%2C%20M.%20V.%2C%20Ihantamalala%2C%20F.%20A.%2C%20Herbreteau%2C%20V.%2C%20R%26%23xE9%3Bvillion%2C%20C.%2C%20Delaitre%2C%20E.%2C%20Catry%2C%20T.%2C%20%26amp%3B%20Garchitorena%2C%20A.%20%282025%29.%20Monitoring%20individual%20rice%20field%20flooding%20dynamics%20over%20a%20large%20scale%20to%20improve%20mosquito%20surveillance%20and%20control.%20%26lt%3Bi%26gt%3BMalaria%20Journal%26lt%3B%5C%2Fi%26gt%3B%2C%20%26lt%3Bi%26gt%3B24%26lt%3B%5C%2Fi%26gt%3B%281%29%2C%20107.%20%26lt%3Ba%20class%3D%26%23039%3Bzp-DOIURL%26%23039%3B%20target%3D%26%23039%3B_blank%26%23039%3B%20href%3D%26%23039%3Bhttps%3A%5C%2F%5C%2Fdoi.org%5C%2F10.1186%5C%2Fs12936-025-05344-3%26%23039%3B%26gt%3Bhttps%3A%5C%2F%5C%2Fdoi.org%5C%2F10.1186%5C%2Fs12936-025-05344-3%26lt%3B%5C%2Fa%26gt%3B%20%26lt%3Ba%20title%3D%26%23039%3BCite%20in%20RIS%20Format%26%23039%3B%20class%3D%26%23039%3Bzp-CiteRIS%26%23039%3B%20data-zp-cite%3D%26%23039%3Bapi_user_id%3D4800755%26amp%3Bitem_key%3DB6QC8VC7%26%23039%3B%20href%3D%26%23039%3Bjavascript%3Avoid%280%29%3B%26%23039%3B%26gt%3BCite%26lt%3B%5C%2Fa%26gt%3B%20%26lt%3B%5C%2Fdiv%26gt%3B%5Cn%26lt%3B%5C%2Fdiv%26gt%3B%22%2C%22data%22%3A%7B%22itemType%22%3A%22journalArticle%22%2C%22title%22%3A%22Monitoring%20individual%20rice%20field%20flooding%20dynamics%20over%20a%20large%20scale%20to%20improve%20mosquito%20surveillance%20and%20control%22%2C%22creators%22%3A%5B%7B%22creatorType%22%3A%22author%22%2C%22firstName%22%3A%22Mauricianot%22%2C%22lastName%22%3A%22Randriamihaja%22%7D%2C%7B%22creatorType%22%3A%22author%22%2C%22firstName%22%3A%22Tokiniaina%20M.%22%2C%22lastName%22%3A%22Randrianjatovo%22%7D%2C%7B%22creatorType%22%3A%22author%22%2C%22firstName%22%3A%22Michelle%20V.%22%2C%22lastName%22%3A%22Evans%22%7D%2C%7B%22creatorType%22%3A%22author%22%2C%22firstName%22%3A%22Felana%20A.%22%2C%22lastName%22%3A%22Ihantamalala%22%7D%2C%7B%22creatorType%22%3A%22author%22%2C%22firstName%22%3A%22Vincent%22%2C%22lastName%22%3A%22Herbreteau%22%7D%2C%7B%22creatorType%22%3A%22author%22%2C%22firstName%22%3A%22Christophe%22%2C%22lastName%22%3A%22R%5Cu00e9villion%22%7D%2C%7B%22creatorType%22%3A%22author%22%2C%22firstName%22%3A%22Eric%22%2C%22lastName%22%3A%22Delaitre%22%7D%2C%7B%22creatorType%22%3A%22author%22%2C%22firstName%22%3A%22Thibault%22%2C%22lastName%22%3A%22Catry%22%7D%2C%7B%22creatorType%22%3A%22author%22%2C%22firstName%22%3A%22Andres%22%2C%22lastName%22%3A%22Garchitorena%22%7D%5D%2C%22abstractNote%22%3A%22%22%2C%22date%22%3A%222025-04-01%22%2C%22section%22%3A%22%22%2C%22partNumber%22%3A%22%22%2C%22partTitle%22%3A%22%22%2C%22DOI%22%3A%2210.1186%5C%2Fs12936-025-05344-3%22%2C%22citationKey%22%3A%22%22%2C%22url%22%3A%22https%3A%5C%2F%5C%2Fmalariajournal.biomedcentral.com%5C%2Farticles%5C%2F10.1186%5C%2Fs12936-025-05344-3%22%2C%22PMID%22%3A%22%22%2C%22PMCID%22%3A%22%22%2C%22ISSN%22%3A%221475-2875%22%2C%22language%22%3A%22en%22%2C%22collections%22%3A%5B%5D%2C%22dateModified%22%3A%222025-07-01T15%3A41%3A12Z%22%7D%7D%2C%7B%22key%22%3A%22MZ56T8Y2%22%2C%22library%22%3A%7B%22id%22%3A4800755%7D%2C%22meta%22%3A%7B%22creatorSummary%22%3A%22Evans%20et%20al.%22%2C%22parsedDate%22%3A%222025-01-30%22%2C%22numChildren%22%3A0%7D%2C%22bib%22%3A%22%26lt%3Bdiv%20class%3D%26quot%3Bcsl-bib-body%26quot%3B%20style%3D%26quot%3Bline-height%3A%202%3B%20padding-left%3A%201em%3B%20text-indent%3A-1em%3B%26quot%3B%26gt%3B%5Cn%20%20%26lt%3Bdiv%20class%3D%26quot%3Bcsl-entry%26quot%3B%26gt%3BEvans%2C%20M.%20V.%2C%20Ihantamalala%2C%20F.%20A.%2C%20Randriamihaja%2C%20M.%2C%20Herbreteau%2C%20V.%2C%20R%26%23xE9%3Bvillion%2C%20C.%2C%20Catry%2C%20T.%2C%20Delaitre%2C%20E.%2C%20Bonds%2C%20M.%20H.%2C%20Roche%2C%20B.%2C%20Mitsinjoniala%2C%20E.%2C%20Ralaivavikoa%2C%20F.%20A.%2C%20Razafinjato%2C%20B.%2C%20Raobela%2C%20O.%2C%20%26amp%3B%20Garchitorena%2C%20A.%20%282025%29.%20Increasing%20the%20resolution%20of%20malaria%20early%20warning%20systems%20for%20use%20by%20local%20health%20actors.%20%26lt%3Bi%26gt%3BMalaria%20Journal%26lt%3B%5C%2Fi%26gt%3B%2C%20%26lt%3Bi%26gt%3B24%26lt%3B%5C%2Fi%26gt%3B%281%29%2C%2030.%20%26lt%3Ba%20class%3D%26%23039%3Bzp-DOIURL%26%23039%3B%20target%3D%26%23039%3B_blank%26%23039%3B%20href%3D%26%23039%3Bhttps%3A%5C%2F%5C%2Fdoi.org%5C%2F10.1186%5C%2Fs12936-025-05266-0%26%23039%3B%26gt%3Bhttps%3A%5C%2F%5C%2Fdoi.org%5C%2F10.1186%5C%2Fs12936-025-05266-0%26lt%3B%5C%2Fa%26gt%3B%20%26lt%3Ba%20title%3D%26%23039%3BCite%20in%20RIS%20Format%26%23039%3B%20class%3D%26%23039%3Bzp-CiteRIS%26%23039%3B%20data-zp-cite%3D%26%23039%3Bapi_user_id%3D4800755%26amp%3Bitem_key%3DMZ56T8Y2%26%23039%3B%20href%3D%26%23039%3Bjavascript%3Avoid%280%29%3B%26%23039%3B%26gt%3BCite%26lt%3B%5C%2Fa%26gt%3B%20%26lt%3B%5C%2Fdiv%26gt%3B%5Cn%26lt%3B%5C%2Fdiv%26gt%3B%22%2C%22data%22%3A%7B%22itemType%22%3A%22journalArticle%22%2C%22title%22%3A%22Increasing%20the%20resolution%20of%20malaria%20early%20warning%20systems%20for%20use%20by%20local%20health%20actors%22%2C%22creators%22%3A%5B%7B%22creatorType%22%3A%22author%22%2C%22firstName%22%3A%22Michelle%20V.%22%2C%22lastName%22%3A%22Evans%22%7D%2C%7B%22creatorType%22%3A%22author%22%2C%22firstName%22%3A%22Felana%20A.%22%2C%22lastName%22%3A%22Ihantamalala%22%7D%2C%7B%22creatorType%22%3A%22author%22%2C%22firstName%22%3A%22Mauricianot%22%2C%22lastName%22%3A%22Randriamihaja%22%7D%2C%7B%22creatorType%22%3A%22author%22%2C%22firstName%22%3A%22Vincent%22%2C%22lastName%22%3A%22Herbreteau%22%7D%2C%7B%22creatorType%22%3A%22author%22%2C%22firstName%22%3A%22Christophe%22%2C%22lastName%22%3A%22R%5Cu00e9villion%22%7D%2C%7B%22creatorType%22%3A%22author%22%2C%22firstName%22%3A%22Thibault%22%2C%22lastName%22%3A%22Catry%22%7D%2C%7B%22creatorType%22%3A%22author%22%2C%22firstName%22%3A%22Eric%22%2C%22lastName%22%3A%22Delaitre%22%7D%2C%7B%22creatorType%22%3A%22author%22%2C%22firstName%22%3A%22Matthew%20H.%22%2C%22lastName%22%3A%22Bonds%22%7D%2C%7B%22creatorType%22%3A%22author%22%2C%22firstName%22%3A%22Benjamin%22%2C%22lastName%22%3A%22Roche%22%7D%2C%7B%22creatorType%22%3A%22author%22%2C%22firstName%22%3A%22Ezra%22%2C%22lastName%22%3A%22Mitsinjoniala%22%7D%2C%7B%22creatorType%22%3A%22author%22%2C%22firstName%22%3A%22Fiainamirindra%20A.%22%2C%22lastName%22%3A%22Ralaivavikoa%22%7D%2C%7B%22creatorType%22%3A%22author%22%2C%22firstName%22%3A%22B%5Cu00e9n%5Cu00e9dicte%22%2C%22lastName%22%3A%22Razafinjato%22%7D%2C%7B%22creatorType%22%3A%22author%22%2C%22firstName%22%3A%22Om%5Cu00e9ga%22%2C%22lastName%22%3A%22Raobela%22%7D%2C%7B%22creatorType%22%3A%22author%22%2C%22firstName%22%3A%22Andres%22%2C%22lastName%22%3A%22Garchitorena%22%7D%5D%2C%22abstractNote%22%3A%22Abstract%5Cn%20%20%20%20%20%20%20%20%20%20%20%20%5Cn%20%20%20%20%20%20%20%20%20%20%20%20%20%20Background%5Cn%20%20%20%20%20%20%20%20%20%20%20%20%20%20The%20increasing%20availability%20of%20electronic%20health%20system%20data%20and%20remotely-sensed%20environmental%20variables%20has%20led%20to%20the%20emergence%20of%20statistical%20models%20capable%20of%20producing%20malaria%20forecasts.%20Many%20of%20these%20models%20have%20been%20operationalized%20into%20malaria%20early%20warning%20systems%20%28MEWSs%29%2C%20which%20provide%20predictions%20of%20malaria%20dynamics%20several%20months%20in%20advance%20at%20national%20and%20regional%20levels.%20However%2C%20MEWSs%20rarely%20produce%20predictions%20at%20the%20village-level%2C%20the%20operational%20scale%20of%20community%20health%20systems%20and%20the%20first%20point%20of%20contact%20for%20the%20majority%20of%20rural%20populations%20in%20malaria-endemic%20countries.%5Cn%20%20%20%20%20%20%20%20%20%20%20%20%5Cn%20%20%20%20%20%20%20%20%20%20%20%20%5Cn%20%20%20%20%20%20%20%20%20%20%20%20%20%20Methods%5Cn%20%20%20%20%20%20%20%20%20%20%20%20%20%20This%20study%20developed%20a%20hyper-local%20MEWS%20for%20use%20within%20a%20health-system%20strengthening%20intervention%20in%20rural%20Madagascar.%20It%20combined%20bias-corrected%2C%20village-level%20case%20notification%20data%20with%20remotely%20sensed%20environmental%20variables%20at%20spatial%20scales%20as%20fine%20as%20a%2010%5Cu00a0m%20resolution.%20A%20spatio-temporal%20hierarchical%20generalized%20linear%20regression%20model%20was%20trained%20on%20monthly%20malaria%20case%20data%20from%20195%20communities%20from%202017%20to%202020%20and%20evaluated%20via%20cross-validation.%20The%20model%20was%20then%20integrated%20into%20an%20automated%20workflow%20with%20environmental%20data%20updated%20monthly%20to%20create%20a%20continuously%20updating%20MEWS%20capable%20of%20predicting%20malaria%20cases%20up%20to%20three%20months%20in%20advance%20at%20the%20village-level.%20Predictions%20were%20transformed%20into%20indicators%20relevant%20to%20health%20system%20actors%20by%20estimating%20the%20quantities%20of%20medical%20supplies%20required%20at%20each%20health%20clinic%20and%20the%20number%20of%20cases%20remaining%20untreated%20at%20the%20community%20level.%5Cn%20%20%20%20%20%20%20%20%20%20%20%20%5Cn%20%20%20%20%20%20%20%20%20%20%20%20%5Cn%20%20%20%20%20%20%20%20%20%20%20%20%20%20Results%5Cn%20%20%20%20%20%20%20%20%20%20%20%20%20%20The%20statistical%20model%20was%20able%20to%20accurately%20reproduce%20village-level%20case%20data%2C%20performing%20nearly%20five%20times%20as%20well%20as%20a%20null%20model%20during%20cross-validation.%20The%20dynamic%20environmental%20variables%2C%20particularly%20those%20associated%20with%20standing%20water%20and%20rice%20field%20dynamics%2C%20were%20strongly%20associated%20with%20malaria%20incidence%2C%20allowing%20the%20model%20to%20accurately%20predict%20future%20incidence%20rates.%20The%20MEWS%20represented%20an%20improvement%20of%20over%2050%25%20compared%20to%20existing%20stock%20order%20quantification%20methods%20when%20applied%20retrospectively.%5Cn%20%20%20%20%20%20%20%20%20%20%20%20%5Cn%20%20%20%20%20%20%20%20%20%20%20%20%5Cn%20%20%20%20%20%20%20%20%20%20%20%20%20%20Conclusion%5Cn%20%20%20%20%20%20%20%20%20%20%20%20%20%20This%20study%20demonstrates%20the%20feasibility%20of%20developing%20an%20automatic%2C%20hyper-local%20MEWS%20leveraging%20remotely-sensed%20environmental%20data%20at%20fine%20spatial%20scales.%20As%20health%20system%20data%20become%20increasingly%20digitized%2C%20this%20method%20can%20be%20easily%20applied%20to%20other%20regions%20and%20be%20updated%20with%20near%20real-time%20health%20data%20to%20further%20increase%20performance.%22%2C%22date%22%3A%222025-01-30%22%2C%22section%22%3A%22%22%2C%22partNumber%22%3A%22%22%2C%22partTitle%22%3A%22%22%2C%22DOI%22%3A%2210.1186%5C%2Fs12936-025-05266-0%22%2C%22citationKey%22%3A%22%22%2C%22url%22%3A%22https%3A%5C%2F%5C%2Fmalariajournal.biomedcentral.com%5C%2Farticles%5C%2F10.1186%5C%2Fs12936-025-05266-0%22%2C%22PMID%22%3A%22%22%2C%22PMCID%22%3A%22%22%2C%22ISSN%22%3A%221475-2875%22%2C%22language%22%3A%22en%22%2C%22collections%22%3A%5B%5D%2C%22dateModified%22%3A%222025-02-13T02%3A02%3A36Z%22%7D%7D%2C%7B%22key%22%3A%226JEGAWHR%22%2C%22library%22%3A%7B%22id%22%3A4800755%7D%2C%22meta%22%3A%7B%22creatorSummary%22%3A%22Daud%5Cu00e9%20et%20al.%22%2C%22parsedDate%22%3A%222025%22%2C%22numChildren%22%3A0%7D%2C%22bib%22%3A%22%26lt%3Bdiv%20class%3D%26quot%3Bcsl-bib-body%26quot%3B%20style%3D%26quot%3Bline-height%3A%202%3B%20padding-left%3A%201em%3B%20text-indent%3A-1em%3B%26quot%3B%26gt%3B%5Cn%20%20%26lt%3Bdiv%20class%3D%26quot%3Bcsl-entry%26quot%3B%26gt%3BDaud%26%23xE9%3B%2C%20%26%23xC9%3B.%2C%20Paul%2C%20R.%2C%20Cebeillac%2C%20A.%2C%20Girond%2C%20F.%2C%20Herbreteau%2C%20V.%2C%20%26amp%3B%20Boyer%2C%20S.%20%282025%29.%20La%20dengue%20en%20Asie%20du%20Sud-Est%3A%20Enjeux%20pour%20un%20syst%26%23xE8%3Bme%20de%20surveillance%20transnational%26%23x202F%3B%3A%20Tha%26%23xEF%3Blande%2C%20Laos%2C%20Cambodge%20et%20Vi%26%23xEA%3Btnam.%20In%20G.%20Facal%20%26amp%3B%20J.%20Samuel%20%28Eds.%29%2C%20%26lt%3Bi%26gt%3BL%26%23x2019%3BAsie%20du%20Sud-Est%202025%26lt%3B%5C%2Fi%26gt%3B%20%28pp.%2079%26%23x2013%3B105%29.%20Institut%20de%20recherche%20sur%20l%26%23x2019%3BAsie%20du%20Sud-Est%20contemporaine.%20https%3A%5C%2F%5C%2Fdoi.org%5C%2F10.4000%5C%2F13g86%20%26lt%3Ba%20title%3D%26%23039%3BCite%20in%20RIS%20Format%26%23039%3B%20class%3D%26%23039%3Bzp-CiteRIS%26%23039%3B%20data-zp-cite%3D%26%23039%3Bapi_user_id%3D4800755%26amp%3Bitem_key%3D6JEGAWHR%26%23039%3B%20href%3D%26%23039%3Bjavascript%3Avoid%280%29%3B%26%23039%3B%26gt%3BCite%26lt%3B%5C%2Fa%26gt%3B%20%26lt%3B%5C%2Fdiv%26gt%3B%5Cn%26lt%3B%5C%2Fdiv%26gt%3B%22%2C%22data%22%3A%7B%22itemType%22%3A%22bookSection%22%2C%22title%22%3A%22La%20dengue%20en%20Asie%20du%20Sud-Est%3A%20Enjeux%20pour%20un%20syst%5Cu00e8me%20de%20surveillance%20transnational%20%3A%20Tha%5Cu00eflande%2C%20Laos%2C%20Cambodge%20et%20Vi%5Cu00eatnam%22%2C%22creators%22%3A%5B%7B%22creatorType%22%3A%22editor%22%2C%22firstName%22%3A%22Gabriel%22%2C%22lastName%22%3A%22Facal%22%7D%2C%7B%22creatorType%22%3A%22editor%22%2C%22firstName%22%3A%22J%5Cu00e9r%5Cu00f4me%22%2C%22lastName%22%3A%22Samuel%22%7D%2C%7B%22creatorType%22%3A%22author%22%2C%22firstName%22%3A%22%5Cu00c9ric%22%2C%22lastName%22%3A%22Daud%5Cu00e9%22%7D%2C%7B%22creatorType%22%3A%22author%22%2C%22firstName%22%3A%22Richard%22%2C%22lastName%22%3A%22Paul%22%7D%2C%7B%22creatorType%22%3A%22author%22%2C%22firstName%22%3A%22Alexandre%22%2C%22lastName%22%3A%22Cebeillac%22%7D%2C%7B%22creatorType%22%3A%22author%22%2C%22firstName%22%3A%22Florian%22%2C%22lastName%22%3A%22Girond%22%7D%2C%7B%22creatorType%22%3A%22author%22%2C%22firstName%22%3A%22Vincent%22%2C%22lastName%22%3A%22Herbreteau%22%7D%2C%7B%22creatorType%22%3A%22author%22%2C%22firstName%22%3A%22S%5Cu00e9bastien%22%2C%22lastName%22%3A%22Boyer%22%7D%5D%2C%22abstractNote%22%3A%22Dengue%20is%20a%20disease%20caused%20by%20an%20arbovirus%20transmitted%20by%20mosquito%20vectors%20of%20the%5Cu00a0Aedes%5Cu00a0genus%2C%20primarily%5Cu00a0Aedes%20aegypti%20and%5Cu00a0Aedes%20albopictus%2C%20which%20are%20widely%20distributed%20across%20Southeast%20Asia.%20The%20region%5Cu2019s%20climatic%20conditions%20favor%20their%20proliferation%2C%20while%20increasing%20urbanization%20provides%20abundant%20breeding%20sites%20and%20opportunities%20for%20human-mosquito%20contact.%20In%20the%20absence%20of%20an%20effective%20vaccine%2C%20monitoring%20and%20controlling%20mosquito%20populations%20remain%20essential%20strategies%20for%20combating%20the%20disease%2C%20alongside%20tracking%20the%20dynamics%20of%20local%20and%20regional%20epidemics.%20This%20requires%20regular%20monitoring%20of%20two%20key%20factors%3A%20meteorological%20parameters%2C%20which%20influence%20the%20growth%20and%20decline%20of%20vector%20populations%2C%20and%20human%20mobility%20at%20local%2C%20regional%20and%20transnational%20scales%2C%20which%20shape%20the%20spatio-temporal%20dynamics%20of%20dengue%20transmission.%20Dengue%20is%20therefore%20a%20complex%20pathogenic%20system%2C%20with%20a%20geography%20influenced%20by%20both%20local%20and%20transnational%20factors%2C%20requiring%20multi-scale%20intervention%20strategies.%20This%20chapter%20aims%20to%20present%20dengue%20epidemic%20surveillance%20systems%20in%20four%20countries%20%28Thailand%2C%20Laos%2C%20Cambodia%20and%20Vietnam%29%20and%20to%20outline%20the%20requirements%20for%20establishing%20a%20transnational%20surveillance%20system.%22%2C%22bookTitle%22%3A%22L%5Cu2019Asie%20du%20Sud-Est%202025%22%2C%22date%22%3A%222025%22%2C%22originalDate%22%3A%22%22%2C%22originalPublisher%22%3A%22%22%2C%22originalPlace%22%3A%22%22%2C%22format%22%3A%22%22%2C%22ISBN%22%3A%22978-2-35596-083-3%22%2C%22DOI%22%3A%22%22%2C%22citationKey%22%3A%22%22%2C%22url%22%3A%22https%3A%5C%2F%5C%2Fbooks.openedition.org%5C%2Firasec%5C%2F11377%22%2C%22ISSN%22%3A%22%22%2C%22language%22%3A%22fr%22%2C%22collections%22%3A%5B%5D%2C%22dateModified%22%3A%222025-03-17T04%3A54%3A54Z%22%7D%7D%2C%7B%22key%22%3A%22W7SRPNSJ%22%2C%22library%22%3A%7B%22id%22%3A4800755%7D%2C%22meta%22%3A%7B%22creatorSummary%22%3A%22Tantely%20et%20al.%22%2C%22parsedDate%22%3A%222024-09-10%22%2C%22numChildren%22%3A0%7D%2C%22bib%22%3A%22%26lt%3Bdiv%20class%3D%26quot%3Bcsl-bib-body%26quot%3B%20style%3D%26quot%3Bline-height%3A%202%3B%20padding-left%3A%201em%3B%20text-indent%3A-1em%3B%26quot%3B%26gt%3B%5Cn%20%20%26lt%3Bdiv%20class%3D%26quot%3Bcsl-entry%26quot%3B%26gt%3BTantely%2C%20M.%20L.%2C%20Guis%2C%20H.%2C%20Raharinirina%2C%20M.%20R.%2C%20Ambinintsoa%2C%20M.%20F.%2C%20Randriananjantenaina%2C%20I.%2C%20Velonirina%2C%20H.%20J.%2C%20Revillion%2C%20C.%2C%20Herbreteau%2C%20V.%2C%20Tran%2C%20A.%2C%20%26amp%3B%20Girod%2C%20R.%20%282024%29.%20Mosquito%20dynamics%20and%20their%20drivers%20in%20peri-urban%20Antananarivo%2C%20Madagascar%3A%20insights%20from%20a%20longitudinal%20multi-host%20single-site%20survey.%20%26lt%3Bi%26gt%3BParasites%20%26amp%3B%20Vectors%26lt%3B%5C%2Fi%26gt%3B%2C%20%26lt%3Bi%26gt%3B17%26lt%3B%5C%2Fi%26gt%3B%281%29%2C%20383.%20%26lt%3Ba%20class%3D%26%23039%3Bzp-DOIURL%26%23039%3B%20target%3D%26%23039%3B_blank%26%23039%3B%20href%3D%26%23039%3Bhttps%3A%5C%2F%5C%2Fdoi.org%5C%2F10.1186%5C%2Fs13071-024-06393-4%26%23039%3B%26gt%3Bhttps%3A%5C%2F%5C%2Fdoi.org%5C%2F10.1186%5C%2Fs13071-024-06393-4%26lt%3B%5C%2Fa%26gt%3B%20%26lt%3Ba%20title%3D%26%23039%3BCite%20in%20RIS%20Format%26%23039%3B%20class%3D%26%23039%3Bzp-CiteRIS%26%23039%3B%20data-zp-cite%3D%26%23039%3Bapi_user_id%3D4800755%26amp%3Bitem_key%3DW7SRPNSJ%26%23039%3B%20href%3D%26%23039%3Bjavascript%3Avoid%280%29%3B%26%23039%3B%26gt%3BCite%26lt%3B%5C%2Fa%26gt%3B%20%26lt%3B%5C%2Fdiv%26gt%3B%5Cn%26lt%3B%5C%2Fdiv%26gt%3B%22%2C%22data%22%3A%7B%22itemType%22%3A%22journalArticle%22%2C%22title%22%3A%22Mosquito%20dynamics%20and%20their%20drivers%20in%20peri-urban%20Antananarivo%2C%20Madagascar%3A%20insights%20from%20a%20longitudinal%20multi-host%20single-site%20survey%22%2C%22creators%22%3A%5B%7B%22creatorType%22%3A%22author%22%2C%22firstName%22%3A%22Micha%5Cu00ebl%20Luciano%22%2C%22lastName%22%3A%22Tantely%22%7D%2C%7B%22creatorType%22%3A%22author%22%2C%22firstName%22%3A%22H%5Cu00e9l%5Cu00e8ne%22%2C%22lastName%22%3A%22Guis%22%7D%2C%7B%22creatorType%22%3A%22author%22%2C%22firstName%22%3A%22Manou%20Rominah%22%2C%22lastName%22%3A%22Raharinirina%22%7D%2C%7B%22creatorType%22%3A%22author%22%2C%22firstName%22%3A%22Maminirina%20Fidelis%22%2C%22lastName%22%3A%22Ambinintsoa%22%7D%2C%7B%22creatorType%22%3A%22author%22%2C%22firstName%22%3A%22Iavonirina%22%2C%22lastName%22%3A%22Randriananjantenaina%22%7D%2C%7B%22creatorType%22%3A%22author%22%2C%22firstName%22%3A%22Haja%20Johnson%22%2C%22lastName%22%3A%22Velonirina%22%7D%2C%7B%22creatorType%22%3A%22author%22%2C%22firstName%22%3A%22Christophe%22%2C%22lastName%22%3A%22Revillion%22%7D%2C%7B%22creatorType%22%3A%22author%22%2C%22firstName%22%3A%22Vincent%22%2C%22lastName%22%3A%22Herbreteau%22%7D%2C%7B%22creatorType%22%3A%22author%22%2C%22firstName%22%3A%22Annelise%22%2C%22lastName%22%3A%22Tran%22%7D%2C%7B%22creatorType%22%3A%22author%22%2C%22firstName%22%3A%22Romain%22%2C%22lastName%22%3A%22Girod%22%7D%5D%2C%22abstractNote%22%3A%22Abstract%5Cn%20%20%20%20%20%20%20%20%20%20%20%20%5Cn%20%20%20%20%20%20%20%20%20%20%20%20%20%20Background%5Cn%20%20%20%20%20%20%20%20%20%20%20%20%20%20Antananarivo%2C%20the%20capital%20city%20of%20Madagascar%2C%20is%20experiencing%20a%20steady%20increase%20in%20population%20growth.%20Due%20to%20the%20abundance%20of%20mosquito%20vectors%20in%20this%20locality%2C%20the%20population%20exposed%20to%20mosquito-borne%20diseases%20is%20therefore%20also%20increasing%2C%20as%20is%20the%20risk%20of%20epidemic%20episodes.%20The%20aim%20of%20the%20present%20study%20was%20to%20assess%2C%20in%20a%20resource-limited%20setting%2C%20the%20information%20on%20mosquito%20population%20dynamics%20and%20disease%20transmission%20risk%20that%20can%20be%20provided%20through%20a%20longitudinal%20entomological%20study%20carried%20out%20in%20a%20multi-host%20single%20site.%5Cn%20%20%20%20%20%20%20%20%20%20%20%20%5Cn%20%20%20%20%20%20%20%20%20%20%20%20%5Cn%20%20%20%20%20%20%20%20%20%20%20%20%20%20Methods%5Cn%20%20%20%20%20%20%20%20%20%20%20%20%20%20Mosquitoes%20were%20collected%20every%2015%5Cu00a0days%20over%2016%5Cu00a0months%20%28from%20January%202017%20to%20April%202018%29%20using%20six%20CDC-light%20traps%20in%20a%20peri-urban%20area%20of%20Antananarivo.%20Multivariable%20generalised%20linear%20models%20were%20developed%20using%20indoor%20and%20outdoor%20densities%20of%20the%20predominant%20mosquito%20species%20as%20response%20variables%20and%20moon%20illumination%2C%20environmental%20data%20and%20climatic%20data%20as%20the%20explanatory%20variables.%5Cn%20%20%20%20%20%20%20%20%20%20%20%20%5Cn%20%20%20%20%20%20%20%20%20%20%20%20%5Cn%20%20%20%20%20%20%20%20%20%20%20%20%20%20Results%5Cn%20%20%20%20%20%20%20%20%20%20%20%20%20%20%5Cn%20%20%20%20%20%20%20%20%20%20%20%20%20%20%20%20Overall%2C%2046%2C737%20mosquitoes%20belonging%20to%20at%20least%2020%20species%20were%20collected%2C%20of%20which%5Cn%20%20%20%20%20%20%20%20%20%20%20%20%20%20%20%20Culex%20antennatus%5Cn%20%20%20%20%20%20%20%20%20%20%20%20%20%20%20%20%2868.9%25%29%2C%5Cn%20%20%20%20%20%20%20%20%20%20%20%20%20%20%20%20Culex%20quinquefasciatus%5Cn%20%20%20%20%20%20%20%20%20%20%20%20%20%20%20%20%2819.8%25%29%2C%5Cn%20%20%20%20%20%20%20%20%20%20%20%20%20%20%20%20Culex%20poicilipes%5Cn%20%20%20%20%20%20%20%20%20%20%20%20%20%20%20%20%283.7%25%29%20and%5Cn%20%20%20%20%20%20%20%20%20%20%20%20%20%20%20%20Anopheles%20gambiae%5Cn%20%20%20%20%20%20%20%20%20%20%20%20%20%20%20%20sensu%20lato%20%282.3%25%29%20were%20the%20most%20abundant%20species.%20Mosquito%20densities%20were%20observed%20to%20be%20driven%20by%20moon%20illumination%20and%20climatic%20factors%20interacting%20at%20different%20lag%20periods.%20The%20outdoor%20models%20demonstrated%20biweekly%20and%20seasonal%20patterns%20of%20mosquito%20densities%2C%20while%20the%20indoor%20models%20demonstrated%20only%20a%20seasonal%20pattern.%5Cn%20%20%20%20%20%20%20%20%20%20%20%20%20%20%5Cn%20%20%20%20%20%20%20%20%20%20%20%20%5Cn%20%20%20%20%20%20%20%20%20%20%20%20%5Cn%20%20%20%20%20%20%20%20%20%20%20%20%20%20Conclusions%5Cn%20%20%20%20%20%20%20%20%20%20%20%20%20%20%5Cn%20%20%20%20%20%20%20%20%20%20%20%20%20%20%20%20An%20important%20diversity%20of%20mosquitoes%20exists%20in%20the%20peri-urban%20area%20of%20Antananarivo.%20Some%20well-known%20vector%20species%2C%20such%20as%5Cn%20%20%20%20%20%20%20%20%20%20%20%20%20%20%20%20Cx.%20antennatus%5Cn%20%20%20%20%20%20%20%20%20%20%20%20%20%20%20%20%2C%20a%20major%20vector%20of%20West%20Nile%20virus%20%28WNV%29%20and%20Rift-Valley%20fever%20virus%20%28RVFV%29%2C%5Cn%20%20%20%20%20%20%20%20%20%20%20%20%20%20%20%20Cx.%20quinquefasciatus%5Cn%20%20%20%20%20%20%20%20%20%20%20%20%20%20%20%20%2C%20a%20major%20vector%20of%20WNV%2C%5Cn%20%20%20%20%20%20%20%20%20%20%20%20%20%20%20%20Cx.%20poicilipes%5Cn%20%20%20%20%20%20%20%20%20%20%20%20%20%20%20%20%2C%20a%20candidate%20vector%20of%20RVFV%20and%5Cn%20%20%20%20%20%20%20%20%20%20%20%20%20%20%20%20An.%20gambiae%5Cn%20%20%20%20%20%20%20%20%20%20%20%20%20%20%20%20sensu%20lato%2C%20a%20major%20vector%20of%5Cn%20%20%20%20%20%20%20%20%20%20%20%20%20%20%20%20Plasmodium%5Cn%20%20%20%20%20%20%20%20%20%20%20%20%20%20%20%20spp.%2C%20are%20abundant.%20Importantly%2C%20these%20four%20mosquito%20species%20are%20present%20all%20year%20round%2C%20even%20though%20their%20abundance%20declines%20during%20the%20cold%20dry%20season%2C%20with%20the%20exception%20of%5Cn%20%20%20%20%20%20%20%20%20%20%20%20%20%20%20%20Cx.%20quinquefasciatus%5Cn%20%20%20%20%20%20%20%20%20%20%20%20%20%20%20%20.%20The%20main%20drivers%20of%20their%20abundance%20were%20found%20to%20be%20temperature%2C%20relative%20humidity%20and%20precipitation%2C%20as%20well%20as%5Cu2014for%20outdoor%20abundance%20only%5Cu2014moon%20illumination.%20Identifying%20these%20drivers%20is%20a%20first%20step%20towards%20the%20development%20of%20pathogen%20transmission%20models%20%28R0%20models%29%2C%20which%20are%20key%20to%20inform%20public%20health%20stakeholders%20on%20the%20periods%20of%20most%20risk%20for%20vector-borne%20diseases.%5Cn%20%20%20%20%20%20%20%20%20%20%20%20%20%20%5Cn%20%20%20%20%20%20%20%20%20%20%20%20%5Cn%20%20%20%20%20%20%20%20%20%20%20%20%5Cn%20%20%20%20%20%20%20%20%20%20%20%20%20%20Graphical%20Abstract%22%2C%22date%22%3A%222024-09-10%22%2C%22section%22%3A%22%22%2C%22partNumber%22%3A%22%22%2C%22partTitle%22%3A%22%22%2C%22DOI%22%3A%2210.1186%5C%2Fs13071-024-06393-4%22%2C%22citationKey%22%3A%22%22%2C%22url%22%3A%22https%3A%5C%2F%5C%2Fparasitesandvectors.biomedcentral.com%5C%2Farticles%5C%2F10.1186%5C%2Fs13071-024-06393-4%22%2C%22PMID%22%3A%22%22%2C%22PMCID%22%3A%22%22%2C%22ISSN%22%3A%221756-3305%22%2C%22language%22%3A%22en%22%2C%22collections%22%3A%5B%5D%2C%22dateModified%22%3A%222024-09-29T15%3A33%3A22Z%22%7D%7D%2C%7B%22key%22%3A%22QIK77AU6%22%2C%22library%22%3A%7B%22id%22%3A4800755%7D%2C%22meta%22%3A%7B%22creatorSummary%22%3A%22Yean%20et%20al.%22%2C%22parsedDate%22%3A%222024-07-10%22%2C%22numChildren%22%3A0%7D%2C%22bib%22%3A%22%26lt%3Bdiv%20class%3D%26quot%3Bcsl-bib-body%26quot%3B%20style%3D%26quot%3Bline-height%3A%202%3B%20padding-left%3A%201em%3B%20text-indent%3A-1em%3B%26quot%3B%26gt%3B%5Cn%20%20%26lt%3Bdiv%20class%3D%26quot%3Bcsl-entry%26quot%3B%26gt%3BYean%2C%20S.%2C%20Prasetyo%2C%20D.%20B.%2C%20Marcombe%2C%20S.%2C%20Hadi%2C%20U.%20K.%2C%20Kazim%2C%20A.%20R.%2C%20Tiawsirisup%2C%20S.%2C%20Chinh%2C%20V.%20D.%2C%20Matsuno%2C%20K.%2C%20Low%2C%20V.%20L.%2C%20Bonnet%2C%20S.%2C%20Boulanger%2C%20N.%2C%20Lam%2C%20T.%20T.-Y.%2C%20Abdad%2C%20M.%20Y.%2C%20Herbreteau%2C%20V.%2C%20Chavatte%2C%20J.-M.%2C%20Sum%2C%20S.%2C%20Ren%2C%20T.%2C%20Sakuntabhai%2C%20A.%2C%20Maquart%2C%20P.-O.%2C%20%26%23x2026%3B%20Boyer%2C%20S.%20%282024%29.%20Challenges%20for%20ticks%20and%20tick-borne%20diseases%20research%20in%20Southeast%20Asia%3A%20Insight%20from%20the%20first%20international%20symposium%20in%20Cambodia.%20%26lt%3Bi%26gt%3BPLOS%20Neglected%20Tropical%20Diseases%26lt%3B%5C%2Fi%26gt%3B%2C%20%26lt%3Bi%26gt%3B18%26lt%3B%5C%2Fi%26gt%3B%287%29%2C%20e0012269.%20%26lt%3Ba%20class%3D%26%23039%3Bzp-DOIURL%26%23039%3B%20target%3D%26%23039%3B_blank%26%23039%3B%20href%3D%26%23039%3Bhttps%3A%5C%2F%5C%2Fdoi.org%5C%2F10.1371%5C%2Fjournal.pntd.0012269%26%23039%3B%26gt%3Bhttps%3A%5C%2F%5C%2Fdoi.org%5C%2F10.1371%5C%2Fjournal.pntd.0012269%26lt%3B%5C%2Fa%26gt%3B%20%26lt%3Ba%20title%3D%26%23039%3BCite%20in%20RIS%20Format%26%23039%3B%20class%3D%26%23039%3Bzp-CiteRIS%26%23039%3B%20data-zp-cite%3D%26%23039%3Bapi_user_id%3D4800755%26amp%3Bitem_key%3DQIK77AU6%26%23039%3B%20href%3D%26%23039%3Bjavascript%3Avoid%280%29%3B%26%23039%3B%26gt%3BCite%26lt%3B%5C%2Fa%26gt%3B%20%26lt%3B%5C%2Fdiv%26gt%3B%5Cn%26lt%3B%5C%2Fdiv%26gt%3B%22%2C%22data%22%3A%7B%22itemType%22%3A%22journalArticle%22%2C%22title%22%3A%22Challenges%20for%20ticks%20and%20tick-borne%20diseases%20research%20in%20Southeast%20Asia%3A%20Insight%20from%20the%20first%20international%20symposium%20in%20Cambodia%22%2C%22creators%22%3A%5B%7B%22creatorType%22%3A%22author%22%2C%22firstName%22%3A%22Sony%22%2C%22lastName%22%3A%22Yean%22%7D%2C%7B%22creatorType%22%3A%22author%22%2C%22firstName%22%3A%22Didot%20Budi%22%2C%22lastName%22%3A%22Prasetyo%22%7D%2C%7B%22creatorType%22%3A%22author%22%2C%22firstName%22%3A%22Sebastien%22%2C%22lastName%22%3A%22Marcombe%22%7D%2C%7B%22creatorType%22%3A%22author%22%2C%22firstName%22%3A%22Upik%20Kesumawati%22%2C%22lastName%22%3A%22Hadi%22%7D%2C%7B%22creatorType%22%3A%22author%22%2C%22firstName%22%3A%22Abdul%20Rahman%22%2C%22lastName%22%3A%22Kazim%22%7D%2C%7B%22creatorType%22%3A%22author%22%2C%22firstName%22%3A%22Sonthaya%22%2C%22lastName%22%3A%22Tiawsirisup%22%7D%2C%7B%22creatorType%22%3A%22author%22%2C%22firstName%22%3A%22Vu%20Duc%22%2C%22lastName%22%3A%22Chinh%22%7D%2C%7B%22creatorType%22%3A%22author%22%2C%22firstName%22%3A%22Keita%22%2C%22lastName%22%3A%22Matsuno%22%7D%2C%7B%22creatorType%22%3A%22author%22%2C%22firstName%22%3A%22Van%20Lun%22%2C%22lastName%22%3A%22Low%22%7D%2C%7B%22creatorType%22%3A%22author%22%2C%22firstName%22%3A%22Sarah%22%2C%22lastName%22%3A%22Bonnet%22%7D%2C%7B%22creatorType%22%3A%22author%22%2C%22firstName%22%3A%22Nathalie%22%2C%22lastName%22%3A%22Boulanger%22%7D%2C%7B%22creatorType%22%3A%22author%22%2C%22firstName%22%3A%22Tommy%20Tsan-Yuk%22%2C%22lastName%22%3A%22Lam%22%7D%2C%7B%22creatorType%22%3A%22author%22%2C%22firstName%22%3A%22Mohammad%20Yazid%22%2C%22lastName%22%3A%22Abdad%22%7D%2C%7B%22creatorType%22%3A%22author%22%2C%22firstName%22%3A%22Vincent%22%2C%22lastName%22%3A%22Herbreteau%22%7D%2C%7B%22creatorType%22%3A%22author%22%2C%22firstName%22%3A%22Jean-Marc%22%2C%22lastName%22%3A%22Chavatte%22%7D%2C%7B%22creatorType%22%3A%22author%22%2C%22firstName%22%3A%22Samuth%22%2C%22lastName%22%3A%22Sum%22%7D%2C%7B%22creatorType%22%3A%22author%22%2C%22firstName%22%3A%22Theary%22%2C%22lastName%22%3A%22Ren%22%7D%2C%7B%22creatorType%22%3A%22author%22%2C%22firstName%22%3A%22Anavaj%22%2C%22lastName%22%3A%22Sakuntabhai%22%7D%2C%7B%22creatorType%22%3A%22author%22%2C%22firstName%22%3A%22Pierre-Olivier%22%2C%22lastName%22%3A%22Maquart%22%7D%2C%7B%22creatorType%22%3A%22author%22%2C%22firstName%22%3A%22Antsa%22%2C%22lastName%22%3A%22Rakotonirina%22%7D%2C%7B%22creatorType%22%3A%22author%22%2C%22firstName%22%3A%22Sebastien%22%2C%22lastName%22%3A%22Boyer%22%7D%2C%7B%22creatorType%22%3A%22editor%22%2C%22firstName%22%3A%22Wen-Ping%22%2C%22lastName%22%3A%22Guo%22%7D%5D%2C%22abstractNote%22%3A%22Background%5Cn%20%20%20%20%20%20%20%20%20%20%20%20%20%20Ticks%2C%20as%20critical%20vectors%20of%20a%20variety%20of%20pathogens%2C%20pose%20a%20significant%20public%20health%20challenge%20globally.%20In%20Southeast%20Asia%20%28SEA%29%2C%20ticks%20are%20responsible%20for%20transmitting%20a%20diverse%20array%20of%20pathogens%20affecting%20humans%20and%20animals.%20The%20geographical%20and%20ecological%20diversity%20of%20SEA%20provides%20a%20unique%20environment%20that%20supports%20a%20wide%20range%20of%20tick%20species%2C%20which%20complicates%20the%20management%20and%20study%20of%20tick-borne%20diseases%20%28TBDs%29.%5Cn%20%20%20%20%20%20%20%20%20%20%20%20%5Cn%20%20%20%20%20%20%20%20%20%20%20%20%5Cn%20%20%20%20%20%20%20%20%20%20%20%20%20%20Methodology%5C%2Fprincipal%20findings%5Cn%20%20%20%20%20%20%20%20%20%20%20%20%20%20This%20article%20synthesizes%20findings%20from%20the%20first%20international%20symposium%20on%20ticks%20and%20TBDs%20in%20Southeast%20Asia%2C%20held%20in%20Phnom%20Penh%20on%20June%2022%20and%2023%2C%202023.%20It%20highlights%20regional%20efforts%20to%20understand%20tick%20ecology%20and%20pathogen%20transmission.%5Cn%20%20%20%20%20%20%20%20%20%20%20%20%20%20This%20paper%20proposes%20to%20present%20a%20summary%20of%20the%20various%20presentations%20given%20during%20the%20symposium%20following%203%20main%20parts.%20The%20first%20one%20is%20devoted%20to%20the%20state%20of%20knowledge%20regarding%20ticks%20and%20TBDs%20in%20SEA%20countries%2C%20with%20presentations%20from%206%20different%20countries%2C%20namely%20Cambodia%2C%20Indonesia%2C%20Laos%2C%20Malaysia%2C%20Thailand%2C%20and%20Vietnam.%20The%20second%20part%20focuses%20on%20the%20development%20of%20new%20research%20approaches%20on%20tick-borne%20pathogens%20%28TBPs%29%20and%20TBDs.%20The%20last%20part%20is%20a%20summary%20of%20the%20round%20table%20discussion%20held%20on%20the%20final%20day%2C%20with%20the%20aim%20of%20defining%20the%20most%20important%20challenges%20and%20recommendations%20for%20researches%20on%20TBP%20and%20TBD%20in%20the%20SEA%20region.%5Cn%20%20%20%20%20%20%20%20%20%20%20%20%5Cn%20%20%20%20%20%20%20%20%20%20%20%20%5Cn%20%20%20%20%20%20%20%20%20%20%20%20%20%20Conclusions%5C%2FSignificance%5Cn%20%20%20%20%20%20%20%20%20%20%20%20%20%20Key%20topics%20discussed%20include%20advancements%20in%20diagnostic%20tools%2C%20such%20as%20MALDI-TOF%20MS%20and%20proteomics%2C%20and%20the%20development%20of%20sustainable%20strategies%20for%20tick%20management%20and%20disease%20prevention.%20The%20symposium%20facilitated%20the%20exchange%20of%20knowledge%20and%20collaborative%20networks%20among%20experts%20from%20various%20disciplines%2C%20promoting%20a%20unified%20approach%20to%20tackling%20TBDs%20in%20the%20region.%20The%20symposium%20underscored%20the%20need%20for%20enhanced%20surveillance%2C%20diagnostics%2C%20and%20inter-regional%20cooperation%20to%20manage%20the%20threat%20of%20TBDs%20effectively.%20Recommendations%20include%20the%20establishment%20of%20a%20regional%20database%20for%20tick%20identification%20and%20the%20expansion%20of%20vector%20competence%20studies.%20These%20initiatives%20are%20crucial%20for%20developing%20targeted%20interventions%20and%20understanding%20the%20broader%20implications%20of%20climate%20change%20and%20urbanization%20on%20the%20prevalence%20of%20TBDs.%22%2C%22date%22%3A%222024-7-10%22%2C%22section%22%3A%22%22%2C%22partNumber%22%3A%22%22%2C%22partTitle%22%3A%22%22%2C%22DOI%22%3A%2210.1371%5C%2Fjournal.pntd.0012269%22%2C%22citationKey%22%3A%22%22%2C%22url%22%3A%22https%3A%5C%2F%5C%2Fdx.plos.org%5C%2F10.1371%5C%2Fjournal.pntd.0012269%22%2C%22PMID%22%3A%22%22%2C%22PMCID%22%3A%22%22%2C%22ISSN%22%3A%221935-2735%22%2C%22language%22%3A%22en%22%2C%22collections%22%3A%5B%5D%2C%22dateModified%22%3A%222025-07-01T14%3A46%3A40Z%22%7D%7D%2C%7B%22key%22%3A%22XUNIWSQG%22%2C%22library%22%3A%7B%22id%22%3A4800755%7D%2C%22meta%22%3A%7B%22creatorSummary%22%3A%22Douchet%20et%20al.%22%2C%22parsedDate%22%3A%222024-04-25%22%2C%22numChildren%22%3A0%7D%2C%22bib%22%3A%22%26lt%3Bdiv%20class%3D%26quot%3Bcsl-bib-body%26quot%3B%20style%3D%26quot%3Bline-height%3A%202%3B%20padding-left%3A%201em%3B%20text-indent%3A-1em%3B%26quot%3B%26gt%3B%5Cn%20%20%26lt%3Bdiv%20class%3D%26quot%3Bcsl-entry%26quot%3B%26gt%3BDouchet%2C%20L.%2C%20Menkes%2C%20C.%2C%20Herbreteau%2C%20V.%2C%20Larrieu%2C%20J.%2C%20Bador%2C%20M.%2C%20Goarant%2C%20C.%2C%20%26amp%3B%20Mangeas%2C%20M.%20%282024%29.%20Climate-driven%20models%20of%20leptospirosis%20dynamics%20in%20tropical%20islands%20from%20three%20oceanic%20basins.%20%26lt%3Bi%26gt%3BPLOS%20Neglected%20Tropical%20Diseases%26lt%3B%5C%2Fi%26gt%3B%2C%20%26lt%3Bi%26gt%3B18%26lt%3B%5C%2Fi%26gt%3B%284%29%2C%20e0011717.%20%26lt%3Ba%20class%3D%26%23039%3Bzp-DOIURL%26%23039%3B%20target%3D%26%23039%3B_blank%26%23039%3B%20href%3D%26%23039%3Bhttps%3A%5C%2F%5C%2Fdoi.org%5C%2F10.1371%5C%2Fjournal.pntd.0011717%26%23039%3B%26gt%3Bhttps%3A%5C%2F%5C%2Fdoi.org%5C%2F10.1371%5C%2Fjournal.pntd.0011717%26lt%3B%5C%2Fa%26gt%3B%20%26lt%3Ba%20title%3D%26%23039%3BCite%20in%20RIS%20Format%26%23039%3B%20class%3D%26%23039%3Bzp-CiteRIS%26%23039%3B%20data-zp-cite%3D%26%23039%3Bapi_user_id%3D4800755%26amp%3Bitem_key%3DXUNIWSQG%26%23039%3B%20href%3D%26%23039%3Bjavascript%3Avoid%280%29%3B%26%23039%3B%26gt%3BCite%26lt%3B%5C%2Fa%26gt%3B%20%26lt%3B%5C%2Fdiv%26gt%3B%5Cn%26lt%3B%5C%2Fdiv%26gt%3B%22%2C%22data%22%3A%7B%22itemType%22%3A%22journalArticle%22%2C%22title%22%3A%22Climate-driven%20models%20of%20leptospirosis%20dynamics%20in%20tropical%20islands%20from%20three%20oceanic%20basins%22%2C%22creators%22%3A%5B%7B%22creatorType%22%3A%22author%22%2C%22firstName%22%3A%22L%5Cu00e9a%22%2C%22lastName%22%3A%22Douchet%22%7D%2C%7B%22creatorType%22%3A%22author%22%2C%22firstName%22%3A%22Christophe%22%2C%22lastName%22%3A%22Menkes%22%7D%2C%7B%22creatorType%22%3A%22author%22%2C%22firstName%22%3A%22Vincent%22%2C%22lastName%22%3A%22Herbreteau%22%7D%2C%7B%22creatorType%22%3A%22author%22%2C%22firstName%22%3A%22Jos%5Cu00e9phine%22%2C%22lastName%22%3A%22Larrieu%22%7D%2C%7B%22creatorType%22%3A%22author%22%2C%22firstName%22%3A%22Margot%22%2C%22lastName%22%3A%22Bador%22%7D%2C%7B%22creatorType%22%3A%22author%22%2C%22firstName%22%3A%22Cyrille%22%2C%22lastName%22%3A%22Goarant%22%7D%2C%7B%22creatorType%22%3A%22author%22%2C%22firstName%22%3A%22Morgan%22%2C%22lastName%22%3A%22Mangeas%22%7D%2C%7B%22creatorType%22%3A%22editor%22%2C%22firstName%22%3A%22Dileepa%22%2C%22lastName%22%3A%22Ediriweera%22%7D%5D%2C%22abstractNote%22%3A%22Background%5Cn%20%20%20%20%20%20%20%20%20%20%20%20%20%20Leptospirosis%20is%20a%20neglected%20zoonosis%20which%20remains%20poorly%20known%20despite%20its%20epidemic%20potential%2C%20especially%20in%20tropical%20islands%20where%20outdoor%20lifestyle%2C%20vulnerability%20to%20invasive%20reservoir%20species%20and%20hot%20and%20rainy%20climate%20constitute%20higher%20risks%20for%20infections.%20Burden%20remains%20poorly%20documented%20while%20outbreaks%20can%20easily%20overflow%20health%20systems%20of%20these%20isolated%20and%20poorly%20populated%20areas.%20Identification%20of%20generic%20patterns%20driving%20leptospirosis%20dynamics%20across%20tropical%20islands%20would%20help%20understand%20its%20epidemiology%20for%20better%20preparedness%20of%20communities.%20In%20this%20study%2C%20we%20aim%20to%20model%20leptospirosis%20seasonality%20and%20outbreaks%20in%20tropical%20islands%20based%20on%20precipitation%20and%20temperature%20indicators.%5Cn%20%20%20%20%20%20%20%20%20%20%20%20%5Cn%20%20%20%20%20%20%20%20%20%20%20%20%5Cn%20%20%20%20%20%20%20%20%20%20%20%20%20%20Methodology%5C%2FPrincipal%20findings%5Cn%20%20%20%20%20%20%20%20%20%20%20%20%20%20%5Cn%20%20%20%20%20%20%20%20%20%20%20%20%20%20%20%20We%20adjusted%20machine%20learning%20models%20on%20leptospirosis%20surveillance%20data%20from%20seven%20tropical%20islands%20%28Guadeloupe%2C%20Reunion%20Island%2C%20Fiji%2C%20Futuna%2C%20New%20Caledonia%2C%20and%20Tahiti%29%20to%20investigate%201%29%20the%20effect%20of%20climate%20on%20the%20disease%5Cu2019s%20seasonal%20dynamic%2C%5Cn%20%20%20%20%20%20%20%20%20%20%20%20%20%20%20%20i%5Cn%20%20%20%20%20%20%20%20%20%20%20%20%20%20%20%20.%5Cn%20%20%20%20%20%20%20%20%20%20%20%20%20%20%20%20e%5Cn%20%20%20%20%20%20%20%20%20%20%20%20%20%20%20%20.%2C%20the%20centered%20seasonal%20profile%20and%202%29%20inter-annual%20anomalies%2C%5Cn%20%20%20%20%20%20%20%20%20%20%20%20%20%20%20%20i%5Cn%20%20%20%20%20%20%20%20%20%20%20%20%20%20%20%20.%5Cn%20%20%20%20%20%20%20%20%20%20%20%20%20%20%20%20e%5Cn%20%20%20%20%20%20%20%20%20%20%20%20%20%20%20%20.%2C%20the%20incidence%20deviations%20from%20the%20seasonal%20profile.%20The%20model%20was%20then%20used%20to%20estimate%20seasonal%20dynamics%20of%20leptospirosis%20in%20Vanuatu%20and%20Puerto%20Rico%20where%20disease%20incidence%20data%20were%20not%20available.%20A%20robust%20model%2C%20validated%20across%20different%20islands%20with%20leave-island-out%20cross-validation%20and%20based%20on%20current%20and%202-month%20lagged%20precipitation%20and%20current%20and%201-month%20lagged%20temperature%2C%20can%20be%20constructed%20to%20estimate%20the%20seasonal%20dynamic%20of%20leptospirosis.%20In%20opposition%2C%20climate%20determinants%20and%20their%20importance%20in%20estimating%20inter-annual%20anomalies%20highly%20differed%20across%20islands.%5Cn%20%20%20%20%20%20%20%20%20%20%20%20%20%20%5Cn%20%20%20%20%20%20%20%20%20%20%20%20%5Cn%20%20%20%20%20%20%20%20%20%20%20%20%5Cn%20%20%20%20%20%20%20%20%20%20%20%20%20%20Conclusions%5C%2FSignificance%5Cn%20%20%20%20%20%20%20%20%20%20%20%20%20%20Climate%20appears%20as%20a%20strong%20determinant%20of%20leptospirosis%20seasonality%20in%20tropical%20islands%20regardless%20of%20the%20diversity%20of%20the%20considered%20environments%20and%20the%20different%20lifestyles%20across%20the%20islands.%20However%2C%20predictive%20and%20expandable%20abilities%20from%20climate%20indicators%20weaken%20when%20estimating%20inter-annual%20outbreaks%20and%20emphasize%20the%20importance%20of%20these%20local%20characteristics%20in%20the%20occurrence%20of%20outbreaks.%22%2C%22date%22%3A%222024-4-25%22%2C%22section%22%3A%22%22%2C%22partNumber%22%3A%22%22%2C%22partTitle%22%3A%22%22%2C%22DOI%22%3A%2210.1371%5C%2Fjournal.pntd.0011717%22%2C%22citationKey%22%3A%22%22%2C%22url%22%3A%22https%3A%5C%2F%5C%2Fdx.plos.org%5C%2F10.1371%5C%2Fjournal.pntd.0011717%22%2C%22PMID%22%3A%22%22%2C%22PMCID%22%3A%22%22%2C%22ISSN%22%3A%221935-2735%22%2C%22language%22%3A%22en%22%2C%22collections%22%3A%5B%5D%2C%22dateModified%22%3A%222024-09-06T04%3A03%3A51Z%22%7D%7D%2C%7B%22key%22%3A%22AXVPYUZU%22%2C%22library%22%3A%7B%22id%22%3A4800755%7D%2C%22meta%22%3A%7B%22creatorSummary%22%3A%22Legendre%20et%20al.%22%2C%22parsedDate%22%3A%222023%22%2C%22numChildren%22%3A0%7D%2C%22bib%22%3A%22%26lt%3Bdiv%20class%3D%26quot%3Bcsl-bib-body%26quot%3B%20style%3D%26quot%3Bline-height%3A%202%3B%20padding-left%3A%201em%3B%20text-indent%3A-1em%3B%26quot%3B%26gt%3B%5Cn%20%20%26lt%3Bdiv%20class%3D%26quot%3Bcsl-entry%26quot%3B%26gt%3BLegendre%2C%20E.%2C%20Lehot%2C%20L.%2C%20Dieng%2C%20S.%2C%20Rebaudet%2C%20S.%2C%20Thu%2C%20A.%20M.%2C%20Rae%2C%20J.%20D.%2C%20Delmas%2C%20G.%2C%20Girond%2C%20F.%2C%20Herbreteau%2C%20V.%2C%20Nosten%2C%20F.%2C%20Landier%2C%20J.%2C%20%26amp%3B%20Gaudart%2C%20J.%20%282023%29.%20Malaria%20Temporal%20Dynamic%20Clustering%20for%20Surveillance%20and%20Intervention%20Planning.%20%26lt%3Bi%26gt%3BEpidemics%26lt%3B%5C%2Fi%26gt%3B%2C%20100682.%20%26lt%3Ba%20class%3D%26%23039%3Bzp-DOIURL%26%23039%3B%20target%3D%26%23039%3B_blank%26%23039%3B%20href%3D%26%23039%3Bhttps%3A%5C%2F%5C%2Fdoi.org%5C%2F10.1016%5C%2Fj.epidem.2023.100682%26%23039%3B%26gt%3Bhttps%3A%5C%2F%5C%2Fdoi.org%5C%2F10.1016%5C%2Fj.epidem.2023.100682%26lt%3B%5C%2Fa%26gt%3B%20%26lt%3Ba%20title%3D%26%23039%3BCite%20in%20RIS%20Format%26%23039%3B%20class%3D%26%23039%3Bzp-CiteRIS%26%23039%3B%20data-zp-cite%3D%26%23039%3Bapi_user_id%3D4800755%26amp%3Bitem_key%3DAXVPYUZU%26%23039%3B%20href%3D%26%23039%3Bjavascript%3Avoid%280%29%3B%26%23039%3B%26gt%3BCite%26lt%3B%5C%2Fa%26gt%3B%20%26lt%3B%5C%2Fdiv%26gt%3B%5Cn%26lt%3B%5C%2Fdiv%26gt%3B%22%2C%22data%22%3A%7B%22itemType%22%3A%22journalArticle%22%2C%22title%22%3A%22Malaria%20Temporal%20Dynamic%20Clustering%20for%20Surveillance%20and%20Intervention%20Planning%22%2C%22creators%22%3A%5B%7B%22creatorType%22%3A%22author%22%2C%22firstName%22%3A%22Eva%22%2C%22lastName%22%3A%22Legendre%22%7D%2C%7B%22creatorType%22%3A%22author%22%2C%22firstName%22%3A%22Laurent%22%2C%22lastName%22%3A%22Lehot%22%7D%2C%7B%22creatorType%22%3A%22author%22%2C%22firstName%22%3A%22Sokhna%22%2C%22lastName%22%3A%22Dieng%22%7D%2C%7B%22creatorType%22%3A%22author%22%2C%22firstName%22%3A%22Stanislas%22%2C%22lastName%22%3A%22Rebaudet%22%7D%2C%7B%22creatorType%22%3A%22author%22%2C%22firstName%22%3A%22Aung%20Myint%22%2C%22lastName%22%3A%22Thu%22%7D%2C%7B%22creatorType%22%3A%22author%22%2C%22firstName%22%3A%22Jade%20D%22%2C%22lastName%22%3A%22Rae%22%7D%2C%7B%22creatorType%22%3A%22author%22%2C%22firstName%22%3A%22Gilles%22%2C%22lastName%22%3A%22Delmas%22%7D%2C%7B%22creatorType%22%3A%22author%22%2C%22firstName%22%3A%22Florian%22%2C%22lastName%22%3A%22Girond%22%7D%2C%7B%22creatorType%22%3A%22author%22%2C%22firstName%22%3A%22Vincent%22%2C%22lastName%22%3A%22Herbreteau%22%7D%2C%7B%22creatorType%22%3A%22author%22%2C%22firstName%22%3A%22Fran%5Cu00e7ois%22%2C%22lastName%22%3A%22Nosten%22%7D%2C%7B%22creatorType%22%3A%22author%22%2C%22firstName%22%3A%22Jordi%22%2C%22lastName%22%3A%22Landier%22%7D%2C%7B%22creatorType%22%3A%22author%22%2C%22firstName%22%3A%22Jean%22%2C%22lastName%22%3A%22Gaudart%22%7D%5D%2C%22abstractNote%22%3A%22%22%2C%22date%22%3A%223%5C%2F2023%22%2C%22section%22%3A%22%22%2C%22partNumber%22%3A%22%22%2C%22partTitle%22%3A%22%22%2C%22DOI%22%3A%2210.1016%5C%2Fj.epidem.2023.100682%22%2C%22citationKey%22%3A%22%22%2C%22url%22%3A%22https%3A%5C%2F%5C%2Flinkinghub.elsevier.com%5C%2Fretrieve%5C%2Fpii%5C%2FS175543652300018X%22%2C%22PMID%22%3A%22%22%2C%22PMCID%22%3A%22%22%2C%22ISSN%22%3A%2217554365%22%2C%22language%22%3A%22en%22%2C%22collections%22%3A%5B%5D%2C%22dateModified%22%3A%222023-03-30T14%3A00%3A49Z%22%7D%7D%2C%7B%22key%22%3A%222UKVSNTA%22%2C%22library%22%3A%7B%22id%22%3A4800755%7D%2C%22meta%22%3A%7B%22creatorSummary%22%3A%22Chaumeau%20et%20al.%22%2C%22parsedDate%22%3A%222022-09-09%22%2C%22numChildren%22%3A0%7D%2C%22bib%22%3A%22%26lt%3Bdiv%20class%3D%26quot%3Bcsl-bib-body%26quot%3B%20style%3D%26quot%3Bline-height%3A%202%3B%20padding-left%3A%201em%3B%20text-indent%3A-1em%3B%26quot%3B%26gt%3B%5Cn%20%20%26lt%3Bdiv%20class%3D%26quot%3Bcsl-entry%26quot%3B%26gt%3BChaumeau%2C%20V.%2C%20Kajeechiwa%2C%20L.%2C%20Kulabkeeree%2C%20T.%2C%20Sawasdichai%2C%20S.%2C%20Haohankhunnatham%2C%20W.%2C%20Inta%2C%20A.%2C%20Phanaphadungtham%2C%20M.%2C%20Girond%2C%20F.%2C%20Herbreteau%2C%20V.%2C%20Delmas%2C%20G.%2C%20%26amp%3B%20Nosten%2C%20F.%20%282022%29.%20Outdoor%20residual%20spraying%20for%20malaria%20vector-control%20in%20Kayin%20%28Karen%29%20state%2C%20Myanmar%3A%20A%20cluster%20randomized%20controlled%20trial.%20%26lt%3Bi%26gt%3BPLOS%20ONE%26lt%3B%5C%2Fi%26gt%3B%2C%20%26lt%3Bi%26gt%3B17%26lt%3B%5C%2Fi%26gt%3B%289%29%2C%20e0274320.%20%26lt%3Ba%20class%3D%26%23039%3Bzp-DOIURL%26%23039%3B%20target%3D%26%23039%3B_blank%26%23039%3B%20href%3D%26%23039%3Bhttps%3A%5C%2F%5C%2Fdoi.org%5C%2F10.1371%5C%2Fjournal.pone.0274320%26%23039%3B%26gt%3Bhttps%3A%5C%2F%5C%2Fdoi.org%5C%2F10.1371%5C%2Fjournal.pone.0274320%26lt%3B%5C%2Fa%26gt%3B%20%26lt%3Ba%20title%3D%26%23039%3BCite%20in%20RIS%20Format%26%23039%3B%20class%3D%26%23039%3Bzp-CiteRIS%26%23039%3B%20data-zp-cite%3D%26%23039%3Bapi_user_id%3D4800755%26amp%3Bitem_key%3D2UKVSNTA%26%23039%3B%20href%3D%26%23039%3Bjavascript%3Avoid%280%29%3B%26%23039%3B%26gt%3BCite%26lt%3B%5C%2Fa%26gt%3B%20%26lt%3B%5C%2Fdiv%26gt%3B%5Cn%26lt%3B%5C%2Fdiv%26gt%3B%22%2C%22data%22%3A%7B%22itemType%22%3A%22journalArticle%22%2C%22title%22%3A%22Outdoor%20residual%20spraying%20for%20malaria%20vector-control%20in%20Kayin%20%28Karen%29%20state%2C%20Myanmar%3A%20A%20cluster%20randomized%20controlled%20trial%22%2C%22creators%22%3A%5B%7B%22creatorType%22%3A%22author%22%2C%22firstName%22%3A%22Victor%22%2C%22lastName%22%3A%22Chaumeau%22%7D%2C%7B%22creatorType%22%3A%22author%22%2C%22firstName%22%3A%22Ladda%22%2C%22lastName%22%3A%22Kajeechiwa%22%7D%2C%7B%22creatorType%22%3A%22author%22%2C%22firstName%22%3A%22Thithiworada%22%2C%22lastName%22%3A%22Kulabkeeree%22%7D%2C%7B%22creatorType%22%3A%22author%22%2C%22firstName%22%3A%22Sunisa%22%2C%22lastName%22%3A%22Sawasdichai%22%7D%2C%7B%22creatorType%22%3A%22author%22%2C%22firstName%22%3A%22Warat%22%2C%22lastName%22%3A%22Haohankhunnatham%22%7D%2C%7B%22creatorType%22%3A%22author%22%2C%22firstName%22%3A%22Aritsara%22%2C%22lastName%22%3A%22Inta%22%7D%2C%7B%22creatorType%22%3A%22author%22%2C%22firstName%22%3A%22Monthicha%22%2C%22lastName%22%3A%22Phanaphadungtham%22%7D%2C%7B%22creatorType%22%3A%22author%22%2C%22firstName%22%3A%22Florian%22%2C%22lastName%22%3A%22Girond%22%7D%2C%7B%22creatorType%22%3A%22author%22%2C%22firstName%22%3A%22Vincent%22%2C%22lastName%22%3A%22Herbreteau%22%7D%2C%7B%22creatorType%22%3A%22author%22%2C%22firstName%22%3A%22Gilles%22%2C%22lastName%22%3A%22Delmas%22%7D%2C%7B%22creatorType%22%3A%22author%22%2C%22firstName%22%3A%22Fran%5Cu00e7ois%22%2C%22lastName%22%3A%22Nosten%22%7D%2C%7B%22creatorType%22%3A%22editor%22%2C%22firstName%22%3A%22Myat%20Htut%22%2C%22lastName%22%3A%22Nyunt%22%7D%5D%2C%22abstractNote%22%3A%22Outdoor%20and%20early%20biting%20by%20mosquitoes%20challenge%20the%20efficacy%20of%20bed%20nets%20and%20indoor%20residual%20spraying%20against%20malaria%20in%20the%20Greater%20Mekong%20Subregion.%20The%20objective%20of%20this%20study%20was%20to%20assess%20the%20efficacy%20of%20outdoor%20residual%20spraying%20%28ORS%29%20for%20malaria%20vector-control%20in%20this%20region.%20A%20cluster%20randomized%20controlled%20trial%20was%20conducted%20between%20July%202018%20and%20April%202019%20in%20twelve%20villages%20in%20Karen%20%28Kayin%29%20state%2C%20Myanmar.%20Villages%20were%20randomly%20assigned%20to%20receive%20either%20a%20single%20round%20of%20ORS%20with%20a%20capsule%20suspension%20of%20lambda-cyhalothrin%20for%20two%20days%20in%20October%20or%20no%20intervention%20%28six%20villages%20per%20group%29.%20The%20primary%20endpoint%20was%20the%20biting%20rate%20of%20malaria%20mosquitoes%20assessed%20with%20human-landing%20catch%20and%20cow-baited%20trap%20collection%20methods%2C%20and%20was%20analyzed%20with%20a%20Bayesian%20multi-level%20model.%20In%20the%20intervention%20villages%2C%20the%20proportion%20of%20households%20located%20within%20the%20sprayed%20area%20ranged%20between%2042%20and%20100%25%20and%20the%20application%20rate%20ranged%20between%2063%20and%20559%20g%20of%20active%20ingredient%20per%20hectare.%20At%20baseline%2C%20the%20median%20of%5Cn%20%20%20%20%20%20%20%20%20%20%20%20%20%20Anopheles%5Cn%20%20%20%20%20%20%20%20%20%20%20%20%20%20biting%20rate%20estimates%20in%20the%20twelve%20villages%20was%202%20bites%20per%20person%20per%20night%20%28inter-quartile%20range%20%5BIQR%5D%200%5Cu20135%2C%20range%200%5Cu201348%29%20indoors%2C%206%20bites%20per%20person%20per%20night%20%28IQR%202%5Cu201316%2C%20range%200%5Cu2013342%29%20outdoors%20and%20206%20bites%20per%20cow%20per%20night%20%28IQR%2083%5Cu2013380%2C%20range%2019%5Cu20131149%29%20in%20the%20cow-baited%20trap.%20In%20intention-to-treat%20analysis%2C%20it%20was%20estimated%20that%20ORS%20reduced%20biting%20rate%20by%2072%25%20%2895%25%20confidence%20interval%20%5BCI%5D%2063%5Cu201379%29%20from%20Month%200%20to%20Month%203%20and%20by%2079%25%20%2895%25%20CI%2062%5Cu201388%29%20from%20Month%204%20to%20Month%206%2C%20considering%20control%20villages%20as%20the%20reference.%20In%20conclusion%2C%20ORS%20rapidly%20reduces%20the%20biting%20rates%20of%20malaria%20mosquitoes%20in%20a%20Southeast%20Asian%20setting%20where%20the%20vectors%20bite%20mostly%20outdoors%20and%20at%20a%20time%20when%20people%20are%20not%20protected%20by%20mosquito%20bed%20nets.%22%2C%22date%22%3A%222022-9-9%22%2C%22section%22%3A%22%22%2C%22partNumber%22%3A%22%22%2C%22partTitle%22%3A%22%22%2C%22DOI%22%3A%2210.1371%5C%2Fjournal.pone.0274320%22%2C%22citationKey%22%3A%22%22%2C%22url%22%3A%22https%3A%5C%2F%5C%2Fdx.plos.org%5C%2F10.1371%5C%2Fjournal.pone.0274320%22%2C%22PMID%22%3A%22%22%2C%22PMCID%22%3A%22%22%2C%22ISSN%22%3A%221932-6203%22%2C%22language%22%3A%22en%22%2C%22collections%22%3A%5B%5D%2C%22dateModified%22%3A%222022-10-02T14%3A32%3A55Z%22%7D%7D%2C%7B%22key%22%3A%22QDZAPCM9%22%2C%22library%22%3A%7B%22id%22%3A4800755%7D%2C%22meta%22%3A%7B%22creatorSummary%22%3A%22Bonnin%20et%20al.%22%2C%22parsedDate%22%3A%222022%22%2C%22numChildren%22%3A0%7D%2C%22bib%22%3A%22%26lt%3Bdiv%20class%3D%26quot%3Bcsl-bib-body%26quot%3B%20style%3D%26quot%3Bline-height%3A%202%3B%20padding-left%3A%201em%3B%20text-indent%3A-1em%3B%26quot%3B%26gt%3B%5Cn%20%20%26lt%3Bdiv%20class%3D%26quot%3Bcsl-entry%26quot%3B%26gt%3BBonnin%2C%20L.%2C%20Tran%2C%20A.%2C%20Herbreteau%2C%20V.%2C%20Marcombe%2C%20S.%2C%20Boyer%2C%20S.%2C%20Mangeas%2C%20M.%2C%20%26amp%3B%20Menkes%2C%20C.%20%282022%29.%20Predicting%20the%20Effects%20of%20Climate%20Change%20on%20Dengue%20Vector%20Densities%20in%20Southeast%20Asia%20through%20Process-Based%20Modeling.%20%26lt%3Bi%26gt%3BEnvironmental%20Health%20Perspectives%26lt%3B%5C%2Fi%26gt%3B%2C%20%26lt%3Bi%26gt%3B130%26lt%3B%5C%2Fi%26gt%3B%2812%29%2C%20127002.%20%26lt%3Ba%20class%3D%26%23039%3Bzp-DOIURL%26%23039%3B%20target%3D%26%23039%3B_blank%26%23039%3B%20href%3D%26%23039%3Bhttps%3A%5C%2F%5C%2Fdoi.org%5C%2F10.1289%5C%2FEHP11068%26%23039%3B%26gt%3Bhttps%3A%5C%2F%5C%2Fdoi.org%5C%2F10.1289%5C%2FEHP11068%26lt%3B%5C%2Fa%26gt%3B%20%26lt%3Ba%20title%3D%26%23039%3BCite%20in%20RIS%20Format%26%23039%3B%20class%3D%26%23039%3Bzp-CiteRIS%26%23039%3B%20data-zp-cite%3D%26%23039%3Bapi_user_id%3D4800755%26amp%3Bitem_key%3DQDZAPCM9%26%23039%3B%20href%3D%26%23039%3Bjavascript%3Avoid%280%29%3B%26%23039%3B%26gt%3BCite%26lt%3B%5C%2Fa%26gt%3B%20%26lt%3B%5C%2Fdiv%26gt%3B%5Cn%26lt%3B%5C%2Fdiv%26gt%3B%22%2C%22data%22%3A%7B%22itemType%22%3A%22journalArticle%22%2C%22title%22%3A%22Predicting%20the%20Effects%20of%20Climate%20Change%20on%20Dengue%20Vector%20Densities%20in%20Southeast%20Asia%20through%20Process-Based%20Modeling%22%2C%22creators%22%3A%5B%7B%22creatorType%22%3A%22author%22%2C%22firstName%22%3A%22Lucas%22%2C%22lastName%22%3A%22Bonnin%22%7D%2C%7B%22creatorType%22%3A%22author%22%2C%22firstName%22%3A%22Annelise%22%2C%22lastName%22%3A%22Tran%22%7D%2C%7B%22creatorType%22%3A%22author%22%2C%22firstName%22%3A%22Vincent%22%2C%22lastName%22%3A%22Herbreteau%22%7D%2C%7B%22creatorType%22%3A%22author%22%2C%22firstName%22%3A%22S%5Cu00e9bastien%22%2C%22lastName%22%3A%22Marcombe%22%7D%2C%7B%22creatorType%22%3A%22author%22%2C%22firstName%22%3A%22S%5Cu00e9bastien%22%2C%22lastName%22%3A%22Boyer%22%7D%2C%7B%22creatorType%22%3A%22author%22%2C%22firstName%22%3A%22Morgan%22%2C%22lastName%22%3A%22Mangeas%22%7D%2C%7B%22creatorType%22%3A%22author%22%2C%22firstName%22%3A%22Christophe%22%2C%22lastName%22%3A%22Menkes%22%7D%5D%2C%22abstractNote%22%3A%22%22%2C%22date%22%3A%2212%5C%2F2022%22%2C%22section%22%3A%22%22%2C%22partNumber%22%3A%22%22%2C%22partTitle%22%3A%22%22%2C%22DOI%22%3A%2210.1289%5C%2FEHP11068%22%2C%22citationKey%22%3A%22%22%2C%22url%22%3A%22https%3A%5C%2F%5C%2Fehp.niehs.nih.gov%5C%2Fdoi%5C%2F10.1289%5C%2FEHP11068%22%2C%22PMID%22%3A%22%22%2C%22PMCID%22%3A%22%22%2C%22ISSN%22%3A%220091-6765%2C%201552-9924%22%2C%22language%22%3A%22en%22%2C%22collections%22%3A%5B%5D%2C%22dateModified%22%3A%222022-12-13T15%3A32%3A47Z%22%7D%7D%2C%7B%22key%22%3A%22SKXLZM47%22%2C%22library%22%3A%7B%22id%22%3A4800755%7D%2C%22meta%22%3A%7B%22creatorSummary%22%3A%22Cristaldi%20et%20al.%22%2C%22parsedDate%22%3A%222022%22%2C%22numChildren%22%3A0%7D%2C%22bib%22%3A%22%26lt%3Bdiv%20class%3D%26quot%3Bcsl-bib-body%26quot%3B%20style%3D%26quot%3Bline-height%3A%202%3B%20padding-left%3A%201em%3B%20text-indent%3A-1em%3B%26quot%3B%26gt%3B%5Cn%20%20%26lt%3Bdiv%20class%3D%26quot%3Bcsl-entry%26quot%3B%26gt%3BCristaldi%2C%20M.%20A.%2C%20Catry%2C%20T.%2C%20Pottier%2C%20A.%2C%20Herbreteau%2C%20V.%2C%20Roux%2C%20E.%2C%20Jacob%2C%20P.%2C%20%26amp%3B%20Previtali%2C%20M.%20A.%20%282022%29.%20Determining%20the%20spatial%20distribution%20of%20environmental%20and%20socio-economic%20suitability%20for%20human%20leptospirosis%20in%20the%20face%20of%20limited%20epidemiological%20data.%20%26lt%3Bi%26gt%3BInfectious%20Diseases%20of%20Poverty%26lt%3B%5C%2Fi%26gt%3B%2C%20%26lt%3Bi%26gt%3B11%26lt%3B%5C%2Fi%26gt%3B%281%29%2C%2086.%20%26lt%3Ba%20class%3D%26%23039%3Bzp-DOIURL%26%23039%3B%20target%3D%26%23039%3B_blank%26%23039%3B%20href%3D%26%23039%3Bhttps%3A%5C%2F%5C%2Fdoi.org%5C%2F10.1186%5C%2Fs40249-022-01010-x%26%23039%3B%26gt%3Bhttps%3A%5C%2F%5C%2Fdoi.org%5C%2F10.1186%5C%2Fs40249-022-01010-x%26lt%3B%5C%2Fa%26gt%3B%20%26lt%3Ba%20title%3D%26%23039%3BCite%20in%20RIS%20Format%26%23039%3B%20class%3D%26%23039%3Bzp-CiteRIS%26%23039%3B%20data-zp-cite%3D%26%23039%3Bapi_user_id%3D4800755%26amp%3Bitem_key%3DSKXLZM47%26%23039%3B%20href%3D%26%23039%3Bjavascript%3Avoid%280%29%3B%26%23039%3B%26gt%3BCite%26lt%3B%5C%2Fa%26gt%3B%20%26lt%3B%5C%2Fdiv%26gt%3B%5Cn%26lt%3B%5C%2Fdiv%26gt%3B%22%2C%22data%22%3A%7B%22itemType%22%3A%22journalArticle%22%2C%22title%22%3A%22Determining%20the%20spatial%20distribution%20of%20environmental%20and%20socio-economic%20suitability%20for%20human%20leptospirosis%20in%20the%20face%20of%20limited%20epidemiological%20data%22%2C%22creators%22%3A%5B%7B%22creatorType%22%3A%22author%22%2C%22firstName%22%3A%22Maximiliano%20A.%22%2C%22lastName%22%3A%22Cristaldi%22%7D%2C%7B%22creatorType%22%3A%22author%22%2C%22firstName%22%3A%22Thibault%22%2C%22lastName%22%3A%22Catry%22%7D%2C%7B%22creatorType%22%3A%22author%22%2C%22firstName%22%3A%22Aur%5Cu00e9a%22%2C%22lastName%22%3A%22Pottier%22%7D%2C%7B%22creatorType%22%3A%22author%22%2C%22firstName%22%3A%22Vincent%22%2C%22lastName%22%3A%22Herbreteau%22%7D%2C%7B%22creatorType%22%3A%22author%22%2C%22firstName%22%3A%22Emmanuel%22%2C%22lastName%22%3A%22Roux%22%7D%2C%7B%22creatorType%22%3A%22author%22%2C%22firstName%22%3A%22Paulina%22%2C%22lastName%22%3A%22Jacob%22%7D%2C%7B%22creatorType%22%3A%22author%22%2C%22firstName%22%3A%22M.%20Andrea%22%2C%22lastName%22%3A%22Previtali%22%7D%5D%2C%22abstractNote%22%3A%22Abstract%5Cn%20%20%20%20%20%20%20%20%20%20%20%20%5Cn%20%20%20%20%20%20%20%20%20%20%20%20%20%20Background%5Cn%20%20%20%20%20%20%20%20%20%20%20%20%20%20Leptospirosis%20is%20among%20the%20leading%20zoonotic%20causes%20of%20morbidity%20and%20mortality%20worldwide.%20Knowledge%20about%20spatial%20patterns%20of%20diseases%20and%20their%20underlying%20processes%20have%20the%20potential%20to%20guide%20intervention%20efforts.%20However%2C%20leptospirosis%20is%20often%20an%20underreported%20and%20misdiagnosed%20disease%20and%20consequently%2C%20spatial%20patterns%20of%20the%20disease%20remain%20unclear.%20In%20the%20absence%20of%20accurate%20epidemiological%20data%20in%20the%20urban%20agglomeration%20of%20Santa%20Fe%2C%20we%20used%20a%20knowledge-based%20index%20and%20cluster%20analysis%20to%20identify%20spatial%20patterns%20of%20environmental%20and%20socioeconomic%20suitability%20for%20the%20disease%20and%20potential%20underlying%20processes%20that%20shape%20them.%5Cn%20%20%20%20%20%20%20%20%20%20%20%20%5Cn%20%20%20%20%20%20%20%20%20%20%20%20%5Cn%20%20%20%20%20%20%20%20%20%20%20%20%20%20Methods%5Cn%20%20%20%20%20%20%20%20%20%20%20%20%20%20We%20geocoded%20human%20leptospirosis%20cases%20derived%20from%20the%20Argentinian%20surveillance%20system%20during%20the%20period%202010%20to%202019.%20Environmental%20and%20socioeconomic%20databases%20were%20obtained%20from%20satellite%20images%20and%20publicly%20available%20platforms%20on%20the%20web.%20Two%20sets%20of%20human%20leptospirosis%20determinants%20were%20considered%20according%20to%20the%20level%20of%20their%20support%20by%20the%20literature%20and%20expert%20knowledge.%20We%20used%20the%20Zonation%20algorithm%20to%20build%20a%20knowledge-based%20index%20and%20a%20clustering%20approach%20to%20identify%20distinct%20potential%20sets%20of%20determinants.%20Spatial%20similarity%20and%20correlations%20between%20index%2C%20clusters%2C%20and%20incidence%20rates%20were%20evaluated.%5Cn%20%20%20%20%20%20%20%20%20%20%20%20%5Cn%20%20%20%20%20%20%20%20%20%20%20%20%5Cn%20%20%20%20%20%20%20%20%20%20%20%20%20%20Results%5Cn%20%20%20%20%20%20%20%20%20%20%20%20%20%20%5Cn%20%20%20%20%20%20%20%20%20%20%20%20%20%20%20%20We%20were%20able%20to%20geocode%2056.36%25%20of%20the%20human%20leptospirosis%20cases%20reported%20in%20the%20national%20epidemiological%20database.%20The%20knowledge-based%20index%20showed%20the%20suitability%20for%20human%20leptospirosis%20in%20the%20UA%20Santa%20Fe%20increased%20from%20downtown%20areas%20of%20the%20largest%20cities%20towards%20peri-urban%20and%20suburban%20areas.%20Cluster%20analysis%20revealed%20downtown%20areas%20were%20characterized%20by%20higher%20levels%20of%20socioeconomic%20conditions.%20Peri-urban%20and%20suburban%20areas%20encompassed%20two%20clusters%20which%20differed%20in%20terms%20of%20environmental%20determinants.%20The%20highest%20incidence%20rates%20overlapped%20areas%20with%20the%20highest%20suitability%20scores%2C%20the%20strength%20of%20association%20was%20low%20though%20%28CSc%5Cn%20%20%20%20%20%20%20%20%20%20%20%20%20%20%20%20r%5Cn%20%20%20%20%20%20%20%20%20%20%20%20%20%20%20%20%5Cu2009%3D%5Cu20090.21%2C%5Cn%20%20%20%20%20%20%20%20%20%20%20%20%20%20%20%20P%5Cn%20%20%20%20%20%20%20%20%20%20%20%20%20%20%20%20%5Cu2009%26lt%3B%5Cu20090.001%20and%20ESc%5Cn%20%20%20%20%20%20%20%20%20%20%20%20%20%20%20%20r%5Cn%20%20%20%20%20%20%20%20%20%20%20%20%20%20%20%20%5Cu2009%3D%5Cu20090.19%2C%5Cn%20%20%20%20%20%20%20%20%20%20%20%20%20%20%20%20P%5Cn%20%20%20%20%20%20%20%20%20%20%20%20%20%20%20%20%5Cu2009%26lt%3B%5Cu20090.001%29.%5Cn%20%20%20%20%20%20%20%20%20%20%20%20%20%20%5Cn%20%20%20%20%20%20%20%20%20%20%20%20%5Cn%20%20%20%20%20%20%20%20%20%20%20%20%5Cn%20%20%20%20%20%20%20%20%20%20%20%20%20%20Conclusions%5Cn%20%20%20%20%20%20%20%20%20%20%20%20%20%20We%20present%20a%20method%20to%20analyze%20the%20environmental%20and%20socioeconomic%20suitability%20for%20human%20leptospirosis%20based%20on%20literature%20and%20expert%20knowledge.%20The%20methodology%20can%20be%20thought%20as%20an%20evolutive%20and%20perfectible%20scheme%20as%20more%20studies%20are%20performed%20in%20the%20area%20and%20novel%20information%20regarding%20determinants%20of%20the%20disease%20become%20available.%20Our%20approach%20can%20be%20a%20valuable%20tool%20for%20decision-makers%20since%20it%20can%20serve%20as%20a%20baseline%20to%20plan%20intervention%20measures.%22%2C%22date%22%3A%2212%5C%2F2022%22%2C%22section%22%3A%22%22%2C%22partNumber%22%3A%22%22%2C%22partTitle%22%3A%22%22%2C%22DOI%22%3A%2210.1186%5C%2Fs40249-022-01010-x%22%2C%22citationKey%22%3A%22%22%2C%22url%22%3A%22https%3A%5C%2F%5C%2Fidpjournal.biomedcentral.com%5C%2Farticles%5C%2F10.1186%5C%2Fs40249-022-01010-x%22%2C%22PMID%22%3A%22%22%2C%22PMCID%22%3A%22%22%2C%22ISSN%22%3A%222049-9957%22%2C%22language%22%3A%22en%22%2C%22collections%22%3A%5B%5D%2C%22dateModified%22%3A%222022-10-02T14%3A32%3A55Z%22%7D%7D%2C%7B%22key%22%3A%22K953YTU9%22%2C%22library%22%3A%7B%22id%22%3A4800755%7D%2C%22meta%22%3A%7B%22creatorSummary%22%3A%22Douchet%20et%20al.%22%2C%22parsedDate%22%3A%222022%22%2C%22numChildren%22%3A0%7D%2C%22bib%22%3A%22%26lt%3Bdiv%20class%3D%26quot%3Bcsl-bib-body%26quot%3B%20style%3D%26quot%3Bline-height%3A%202%3B%20padding-left%3A%201em%3B%20text-indent%3A-1em%3B%26quot%3B%26gt%3B%5Cn%20%20%26lt%3Bdiv%20class%3D%26quot%3Bcsl-entry%26quot%3B%26gt%3BDouchet%2C%20L.%2C%20Goarant%2C%20C.%2C%20Mangeas%2C%20M.%2C%20Menkes%2C%20C.%2C%20Hinjoy%2C%20S.%2C%20%26amp%3B%20Herbreteau%2C%20V.%20%282022%29.%20Unraveling%20the%20invisible%20leptospirosis%20in%20mainland%20Southeast%20Asia%20and%20its%20fate%20under%20climate%20change.%20%26lt%3Bi%26gt%3BScience%20of%20The%20Total%20Environment%26lt%3B%5C%2Fi%26gt%3B%2C%20%26lt%3Bi%26gt%3B832%26lt%3B%5C%2Fi%26gt%3B%2C%20155018.%20%26lt%3Ba%20class%3D%26%23039%3Bzp-DOIURL%26%23039%3B%20target%3D%26%23039%3B_blank%26%23039%3B%20href%3D%26%23039%3Bhttps%3A%5C%2F%5C%2Fdoi.org%5C%2F10.1016%5C%2Fj.scitotenv.2022.155018%26%23039%3B%26gt%3Bhttps%3A%5C%2F%5C%2Fdoi.org%5C%2F10.1016%5C%2Fj.scitotenv.2022.155018%26lt%3B%5C%2Fa%26gt%3B%20%26lt%3Ba%20title%3D%26%23039%3BCite%20in%20RIS%20Format%26%23039%3B%20class%3D%26%23039%3Bzp-CiteRIS%26%23039%3B%20data-zp-cite%3D%26%23039%3Bapi_user_id%3D4800755%26amp%3Bitem_key%3DK953YTU9%26%23039%3B%20href%3D%26%23039%3Bjavascript%3Avoid%280%29%3B%26%23039%3B%26gt%3BCite%26lt%3B%5C%2Fa%26gt%3B%20%26lt%3B%5C%2Fdiv%26gt%3B%5Cn%26lt%3B%5C%2Fdiv%26gt%3B%22%2C%22data%22%3A%7B%22itemType%22%3A%22journalArticle%22%2C%22title%22%3A%22Unraveling%20the%20invisible%20leptospirosis%20in%20mainland%20Southeast%20Asia%20and%20its%20fate%20under%20climate%20change%22%2C%22creators%22%3A%5B%7B%22creatorType%22%3A%22author%22%2C%22firstName%22%3A%22L%5Cu00e9a%22%2C%22lastName%22%3A%22Douchet%22%7D%2C%7B%22creatorType%22%3A%22author%22%2C%22firstName%22%3A%22Cyrille%22%2C%22lastName%22%3A%22Goarant%22%7D%2C%7B%22creatorType%22%3A%22author%22%2C%22firstName%22%3A%22Morgan%22%2C%22lastName%22%3A%22Mangeas%22%7D%2C%7B%22creatorType%22%3A%22author%22%2C%22firstName%22%3A%22Christophe%22%2C%22lastName%22%3A%22Menkes%22%7D%2C%7B%22creatorType%22%3A%22author%22%2C%22firstName%22%3A%22Soawapak%22%2C%22lastName%22%3A%22Hinjoy%22%7D%2C%7B%22creatorType%22%3A%22author%22%2C%22firstName%22%3A%22Vincent%22%2C%22lastName%22%3A%22Herbreteau%22%7D%5D%2C%22abstractNote%22%3A%22%22%2C%22date%22%3A%2208%5C%2F2022%22%2C%22section%22%3A%22%22%2C%22partNumber%22%3A%22%22%2C%22partTitle%22%3A%22%22%2C%22DOI%22%3A%2210.1016%5C%2Fj.scitotenv.2022.155018%22%2C%22citationKey%22%3A%22%22%2C%22url%22%3A%22https%3A%5C%2F%5C%2Flinkinghub.elsevier.com%5C%2Fretrieve%5C%2Fpii%5C%2FS0048969722021118%22%2C%22PMID%22%3A%22%22%2C%22PMCID%22%3A%22%22%2C%22ISSN%22%3A%2200489697%22%2C%22language%22%3A%22en%22%2C%22collections%22%3A%5B%5D%2C%22dateModified%22%3A%222022-10-02T14%3A32%3A55Z%22%7D%7D%2C%7B%22key%22%3A%22UKB3MEVV%22%2C%22library%22%3A%7B%22id%22%3A4800755%7D%2C%22meta%22%3A%7B%22creatorSummary%22%3A%22Ihantamalala%20et%20al.%22%2C%22parsedDate%22%3A%222021-12-01%22%2C%22numChildren%22%3A0%7D%2C%22bib%22%3A%22%26lt%3Bdiv%20class%3D%26quot%3Bcsl-bib-body%26quot%3B%20style%3D%26quot%3Bline-height%3A%202%3B%20padding-left%3A%201em%3B%20text-indent%3A-1em%3B%26quot%3B%26gt%3B%5Cn%20%20%26lt%3Bdiv%20class%3D%26quot%3Bcsl-entry%26quot%3B%26gt%3BIhantamalala%2C%20F.%20A.%2C%20Bonds%2C%20M.%20H.%2C%20Randriamihaja%2C%20M.%2C%20Rakotonirina%2C%20L.%2C%20Herbreteau%2C%20V.%2C%20R%26%23xE9%3Bvillion%2C%20C.%2C%20Rakotoarimanana%2C%20S.%2C%20Cowley%2C%20G.%2C%20Andriatiana%2C%20T.%20A.%2C%20Mayfield%2C%20A.%2C%20Rich%2C%20M.%20L.%2C%20Rakotonanahary%2C%20R.%20J.%20L.%2C%20Finnegan%2C%20K.%20E.%2C%20Ramarson%2C%20A.%2C%20Razafinjato%2C%20B.%2C%20Ramiandrisoa%2C%20B.%2C%20Randrianambinina%2C%20A.%2C%20Cordier%2C%20L.%20F.%2C%20%26amp%3B%20Garchitorena%2C%20A.%20%282021%29.%20Geographic%20barriers%20to%20establishing%20a%20successful%20hospital%20referral%20system%20in%20rural%20Madagascar.%20%26lt%3Bi%26gt%3BBMJ%20Global%20Health%26lt%3B%5C%2Fi%26gt%3B%2C%20%26lt%3Bi%26gt%3B6%26lt%3B%5C%2Fi%26gt%3B%2812%29%2C%20e007145.%20%26lt%3Ba%20class%3D%26%23039%3Bzp-DOIURL%26%23039%3B%20target%3D%26%23039%3B_blank%26%23039%3B%20href%3D%26%23039%3Bhttps%3A%5C%2F%5C%2Fdoi.org%5C%2F10.1136%5C%2Fbmjgh-2021-007145%26%23039%3B%26gt%3Bhttps%3A%5C%2F%5C%2Fdoi.org%5C%2F10.1136%5C%2Fbmjgh-2021-007145%26lt%3B%5C%2Fa%26gt%3B%20%26lt%3Ba%20title%3D%26%23039%3BCite%20in%20RIS%20Format%26%23039%3B%20class%3D%26%23039%3Bzp-CiteRIS%26%23039%3B%20data-zp-cite%3D%26%23039%3Bapi_user_id%3D4800755%26amp%3Bitem_key%3DUKB3MEVV%26%23039%3B%20href%3D%26%23039%3Bjavascript%3Avoid%280%29%3B%26%23039%3B%26gt%3BCite%26lt%3B%5C%2Fa%26gt%3B%20%26lt%3B%5C%2Fdiv%26gt%3B%5Cn%26lt%3B%5C%2Fdiv%26gt%3B%22%2C%22data%22%3A%7B%22itemType%22%3A%22journalArticle%22%2C%22title%22%3A%22Geographic%20barriers%20to%20establishing%20a%20successful%20hospital%20referral%20system%20in%20rural%20Madagascar%22%2C%22creators%22%3A%5B%7B%22creatorType%22%3A%22author%22%2C%22firstName%22%3A%22Felana%20Angella%22%2C%22lastName%22%3A%22Ihantamalala%22%7D%2C%7B%22creatorType%22%3A%22author%22%2C%22firstName%22%3A%22Matthew%20H%22%2C%22lastName%22%3A%22Bonds%22%7D%2C%7B%22creatorType%22%3A%22author%22%2C%22firstName%22%3A%22Mauricianot%22%2C%22lastName%22%3A%22Randriamihaja%22%7D%2C%7B%22creatorType%22%3A%22author%22%2C%22firstName%22%3A%22Luc%22%2C%22lastName%22%3A%22Rakotonirina%22%7D%2C%7B%22creatorType%22%3A%22author%22%2C%22firstName%22%3A%22Vincent%22%2C%22lastName%22%3A%22Herbreteau%22%7D%2C%7B%22creatorType%22%3A%22author%22%2C%22firstName%22%3A%22Christophe%22%2C%22lastName%22%3A%22R%5Cu00e9villion%22%7D%2C%7B%22creatorType%22%3A%22author%22%2C%22firstName%22%3A%22Serge%22%2C%22lastName%22%3A%22Rakotoarimanana%22%7D%2C%7B%22creatorType%22%3A%22author%22%2C%22firstName%22%3A%22Giovanna%22%2C%22lastName%22%3A%22Cowley%22%7D%2C%7B%22creatorType%22%3A%22author%22%2C%22firstName%22%3A%22Tsirinomen%5Cu2019ny%20Aina%22%2C%22lastName%22%3A%22Andriatiana%22%7D%2C%7B%22creatorType%22%3A%22author%22%2C%22firstName%22%3A%22Alishya%22%2C%22lastName%22%3A%22Mayfield%22%7D%2C%7B%22creatorType%22%3A%22author%22%2C%22firstName%22%3A%22Michael%20L%22%2C%22lastName%22%3A%22Rich%22%7D%2C%7B%22creatorType%22%3A%22author%22%2C%22firstName%22%3A%22Rado%20J%20L%22%2C%22lastName%22%3A%22Rakotonanahary%22%7D%2C%7B%22creatorType%22%3A%22author%22%2C%22firstName%22%3A%22Karen%20E%22%2C%22lastName%22%3A%22Finnegan%22%7D%2C%7B%22creatorType%22%3A%22author%22%2C%22firstName%22%3A%22Andriamanolohaja%22%2C%22lastName%22%3A%22Ramarson%22%7D%2C%7B%22creatorType%22%3A%22author%22%2C%22firstName%22%3A%22Benedicte%22%2C%22lastName%22%3A%22Razafinjato%22%7D%2C%7B%22creatorType%22%3A%22author%22%2C%22firstName%22%3A%22Bruno%22%2C%22lastName%22%3A%22Ramiandrisoa%22%7D%2C%7B%22creatorType%22%3A%22author%22%2C%22firstName%22%3A%22Andriamihaja%22%2C%22lastName%22%3A%22Randrianambinina%22%7D%2C%7B%22creatorType%22%3A%22author%22%2C%22firstName%22%3A%22Laura%20F%22%2C%22lastName%22%3A%22Cordier%22%7D%2C%7B%22creatorType%22%3A%22author%22%2C%22firstName%22%3A%22Andres%22%2C%22lastName%22%3A%22Garchitorena%22%7D%5D%2C%22abstractNote%22%3A%22Background%20The%20provision%20of%20emergency%20and%20hospital%20care%20has%20become%20an%20integral%20part%20of%20the%20global%20vision%20for%20universal%20health%20coverage.%20To%20strengthen%20secondary%20care%20systems%2C%20we%20need%20to%20accurately%20understand%20the%20time%20necessary%20for%20populations%20to%20reach%20a%20hospital.%20The%20goal%20of%20this%20study%20was%20to%20develop%20methods%20that%20accurately%20estimate%20referral%20and%20prehospital%20time%20for%20rural%20districts%20in%20low%20and%20middle-income%20countries.%20We%20used%20these%20estimates%20to%20assess%20how%20local%20geography%20can%20limit%20the%20impact%20of%20a%20strengthened%20referral%20programme%20in%20a%20rural%20district%20of%20Madagascar.Methods%20We%20developed%20a%20database%20containing%3A%20travel%20speed%20by%20foot%20and%20motorised%20vehicles%20in%20Ifanadiana%20district%3B%20a%20full%20mapping%20of%20all%20roads%2C%20footpaths%20and%20households%3B%20and%20remotely%20sensed%20data%20on%20terrain%2C%20land%20cover%20and%20climatic%20characteristics.%20We%20used%20this%20information%20to%20calibrate%20estimates%20of%20referral%20and%20prehospital%20time%20based%20on%20the%20shortest%20route%20algorithms%20and%20statistical%20models%20of%20local%20travel%20speed.%20We%20predict%20the%20impact%20on%20referral%20numbers%20of%20strategies%20aimed%20at%20reducing%20referral%20time%20for%20underserved%20populations%20via%20generalised%20linear%20mixed%20models.Results%20About%2010%25%20of%20the%20population%20lived%20less%20than%202%5Cu2009hours%20from%20the%20hospital%2C%20and%20more%20than%20half%20lived%20over%204%5Cu2009hours%20away%2C%20with%20variable%20access%20depending%20on%20climatic%20conditions.%20Only%20the%20four%20health%20centres%20located%20near%20the%20paved%20road%20had%20referral%20times%20to%20the%20hospital%20within%201%5Cu2009hour.%20Referral%20time%20remained%20the%20main%20barrier%20limiting%20the%20number%20of%20referrals%20despite%20health%20system%20strengthening%20efforts.%20The%20addition%20of%20two%20new%20referral%20centres%20is%20estimated%20to%20triple%20the%20population%20living%20within%202%5Cu2009hours%20from%20a%20centre%20with%20better%20emergency%20care%20capacity%20and%20nearly%20double%20the%20number%20of%20expected%20referrals.Conclusion%20This%20study%20demonstrates%20how%20adapting%20geographic%20accessibility%20modelling%20methods%20to%20local%20scales%20can%20occur%20through%20improving%20the%20precision%20of%20travel%20time%20estimates%20and%20pairing%20them%20with%20data%20on%20health%20facility%20use.Data%20are%20available%20in%20a%20public%2C%20open%20access%20repository.%20Data%20are%20available%20upon%20reasonable%20request.%20GIS%20data%20on%20roads%2C%20footpaths%20and%20buildings%20in%20Ifanadiana%20district%20are%20publicly%20available%20on%20OpenStreetMap%20%28https%3A%5C%2F%5C%2Fwww.openstreetmap.org%29%20and%20on%20the%20Shinny%20app%20described%20in%20this%20study%20%28http%3A%5C%2F%5C%2Fresearch.pivot-dashboard.org%3A3838%5C%2F%29.%20Health%20system%20data%20may%20be%20shared%20upon%20request%20to%20the%20address%20research%40pivotworks.org.%22%2C%22date%22%3A%222021-12-01%22%2C%22section%22%3A%22%22%2C%22partNumber%22%3A%22%22%2C%22partTitle%22%3A%22%22%2C%22DOI%22%3A%2210.1136%5C%2Fbmjgh-2021-007145%22%2C%22citationKey%22%3A%22%22%2C%22url%22%3A%22http%3A%5C%2F%5C%2Fgh.bmj.com%5C%2Fcontent%5C%2F6%5C%2F12%5C%2Fe007145.abstract%22%2C%22PMID%22%3A%22%22%2C%22PMCID%22%3A%22%22%2C%22ISSN%22%3A%22%22%2C%22language%22%3A%22%22%2C%22collections%22%3A%5B%5D%2C%22dateModified%22%3A%222022-10-03T02%3A03%3A59Z%22%7D%7D%2C%7B%22key%22%3A%22J7FAUY9S%22%2C%22library%22%3A%7B%22id%22%3A4800755%7D%2C%22meta%22%3A%7B%22creatorSummary%22%3A%22Chhim%20et%20al.%22%2C%22parsedDate%22%3A%222021-02-18%22%2C%22numChildren%22%3A0%7D%2C%22bib%22%3A%22%26lt%3Bdiv%20class%3D%26quot%3Bcsl-bib-body%26quot%3B%20style%3D%26quot%3Bline-height%3A%202%3B%20padding-left%3A%201em%3B%20text-indent%3A-1em%3B%26quot%3B%26gt%3B%5Cn%20%20%26lt%3Bdiv%20class%3D%26quot%3Bcsl-entry%26quot%3B%26gt%3BChhim%2C%20S.%2C%20Piola%2C%20P.%2C%20Housen%2C%20T.%2C%20Herbreteau%2C%20V.%2C%20%26amp%3B%20Tol%2C%20B.%20%282021%29.%20Malaria%20in%20Cambodia%3A%20A%20Retrospective%20Analysis%20of%20a%20Changing%20Epidemiology%202006%26%23x2013%3B2019.%20%26lt%3Bi%26gt%3BInternational%20Journal%20of%20Environmental%20Research%20and%20Public%20Health%26lt%3B%5C%2Fi%26gt%3B%2C%20%26lt%3Bi%26gt%3B18%26lt%3B%5C%2Fi%26gt%3B%284%29%2C%201960.%20%26lt%3Ba%20class%3D%26%23039%3Bzp-DOIURL%26%23039%3B%20target%3D%26%23039%3B_blank%26%23039%3B%20href%3D%26%23039%3Bhttps%3A%5C%2F%5C%2Fdoi.org%5C%2F10.3390%5C%2Fijerph18041960%26%23039%3B%26gt%3Bhttps%3A%5C%2F%5C%2Fdoi.org%5C%2F10.3390%5C%2Fijerph18041960%26lt%3B%5C%2Fa%26gt%3B%20%26lt%3Ba%20title%3D%26%23039%3BCite%20in%20RIS%20Format%26%23039%3B%20class%3D%26%23039%3Bzp-CiteRIS%26%23039%3B%20data-zp-cite%3D%26%23039%3Bapi_user_id%3D4800755%26amp%3Bitem_key%3DJ7FAUY9S%26%23039%3B%20href%3D%26%23039%3Bjavascript%3Avoid%280%29%3B%26%23039%3B%26gt%3BCite%26lt%3B%5C%2Fa%26gt%3B%20%26lt%3B%5C%2Fdiv%26gt%3B%5Cn%26lt%3B%5C%2Fdiv%26gt%3B%22%2C%22data%22%3A%7B%22itemType%22%3A%22journalArticle%22%2C%22title%22%3A%22Malaria%20in%20Cambodia%3A%20A%20Retrospective%20Analysis%20of%20a%20Changing%20Epidemiology%202006%5Cu20132019%22%2C%22creators%22%3A%5B%7B%22creatorType%22%3A%22author%22%2C%22firstName%22%3A%22Srean%22%2C%22lastName%22%3A%22Chhim%22%7D%2C%7B%22creatorType%22%3A%22author%22%2C%22firstName%22%3A%22Patrice%22%2C%22lastName%22%3A%22Piola%22%7D%2C%7B%22creatorType%22%3A%22author%22%2C%22firstName%22%3A%22Tambri%22%2C%22lastName%22%3A%22Housen%22%7D%2C%7B%22creatorType%22%3A%22author%22%2C%22firstName%22%3A%22Vincent%22%2C%22lastName%22%3A%22Herbreteau%22%7D%2C%7B%22creatorType%22%3A%22author%22%2C%22firstName%22%3A%22Bunkea%22%2C%22lastName%22%3A%22Tol%22%7D%5D%2C%22abstractNote%22%3A%22Background%3A%20In%20Cambodia%2C%20malaria%20persists%20with%20changing%20epidemiology%20and%20resistance%20to%20antimalarials.%20This%20study%20aimed%20to%20describe%20how%20malaria%20has%20evolved%20spatially%20from%202006%20to%202019%20in%20Cambodia.%20Methods%3A%20We%20undertook%20a%20secondary%20analysis%20of%20existing%20malaria%20data%20from%20all%20government%20healthcare%20facilities%20in%20Cambodia.%20The%20epidemiology%20of%20malaria%20was%20described%20by%20sex%2C%20age%2C%20seasonality%2C%20and%20species.%20Spatial%20clusters%20at%20the%20district%20level%20were%20identified%20with%20a%20Poisson%20model.%20Results%3A%20Overall%2C%20incidence%20decreased%20from%207.4%20cases%5C%2F1000%20population%20in%202006%20to%201.9%20in%202019.%20The%20decrease%20has%20been%20drastic%20for%20females%2C%20from%206.7%20to%200.6%5C%2F1000.%20Adults%20aged%2015%5Cu201349%20years%20had%20the%20highest%20malaria%20incidence%20among%20all%20age%20groups.%20The%20proportion%20of%20Plasmodium%20%28P.%29%20falciparum%20%2B%20Mixed%20among%20confirmed%20cases%20declined%20from%2087.9%25%20%28n%20%3D%2067%2C489%29%20in%202006%20to%2016.6%25%20%28n%20%3D%205290%29%20in%202019.%20Clusters%20of%20P.%20falciparum%20%2B%20Mixed%20and%20P.%20vivax%20%2B%20Mixed%20were%20detected%20in%20forested%20provinces%20along%20all%20national%20borders.%20Conclusions%3A%20There%20has%20been%20a%20noted%20decrease%20in%20P.%20falciparum%20cases%20in%202019%2C%20suggesting%20that%20an%20intensification%20plan%20should%20be%20maintained.%20A%20decline%20in%20P.%20vivax%20cases%20was%20also%20noted%2C%20although%20less%20pronounced.%20Interventions%20aimed%20at%20preventing%20new%20infections%20of%20P.%20vivax%20and%20relapses%20should%20be%20prioritized.%20All%20detected%20malaria%20cases%20should%20be%20captured%20by%20the%20national%20surveillance%20system%20to%20avoid%20misleading%20trends.%22%2C%22date%22%3A%222021-02-18%22%2C%22section%22%3A%22%22%2C%22partNumber%22%3A%22%22%2C%22partTitle%22%3A%22%22%2C%22DOI%22%3A%2210.3390%5C%2Fijerph18041960%22%2C%22citationKey%22%3A%22%22%2C%22url%22%3A%22https%3A%5C%2F%5C%2Fwww.mdpi.com%5C%2F1660-4601%5C%2F18%5C%2F4%5C%2F1960%22%2C%22PMID%22%3A%22%22%2C%22PMCID%22%3A%22%22%2C%22ISSN%22%3A%221660-4601%22%2C%22language%22%3A%22en%22%2C%22collections%22%3A%5B%5D%2C%22dateModified%22%3A%222022-10-03T02%3A03%3A59Z%22%7D%7D%2C%7B%22key%22%3A%22YMADB83Q%22%2C%22library%22%3A%7B%22id%22%3A4800755%7D%2C%22meta%22%3A%7B%22creatorSummary%22%3A%22Biscornet%20et%20al.%22%2C%22parsedDate%22%3A%222021-01-19%22%2C%22numChildren%22%3A0%7D%2C%22bib%22%3A%22%26lt%3Bdiv%20class%3D%26quot%3Bcsl-bib-body%26quot%3B%20style%3D%26quot%3Bline-height%3A%202%3B%20padding-left%3A%201em%3B%20text-indent%3A-1em%3B%26quot%3B%26gt%3B%5Cn%20%20%26lt%3Bdiv%20class%3D%26quot%3Bcsl-entry%26quot%3B%26gt%3BBiscornet%2C%20L.%2C%20R%26%23xE9%3Bvillion%2C%20C.%2C%20J%26%23xE9%3Bgo%2C%20S.%2C%20Lagadec%2C%20E.%2C%20Gomard%2C%20Y.%2C%20Le%20Minter%2C%20G.%2C%20Rocamora%2C%20G.%2C%20Guernier-Cambert%2C%20V.%2C%20M%26%23xE9%3Blade%2C%20J.%2C%20Dellagi%2C%20K.%2C%20Tortosa%2C%20P.%2C%20%26amp%3B%20Herbreteau%2C%20V.%20%282021%29.%20Predicting%20the%20Presence%20of%20Leptospires%20in%20Rodents%20from%20Environmental%20Indicators%20Opens%20Up%20Opportunities%20for%20Environmental%20Monitoring%20of%20Human%20Leptospirosis.%20%26lt%3Bi%26gt%3BRemote%20Sensing%26lt%3B%5C%2Fi%26gt%3B%2C%20%26lt%3Bi%26gt%3B13%26lt%3B%5C%2Fi%26gt%3B%282%29%2C%20325.%20%26lt%3Ba%20class%3D%26%23039%3Bzp-DOIURL%26%23039%3B%20target%3D%26%23039%3B_blank%26%23039%3B%20href%3D%26%23039%3Bhttps%3A%5C%2F%5C%2Fdoi.org%5C%2F10.3390%5C%2Frs13020325%26%23039%3B%26gt%3Bhttps%3A%5C%2F%5C%2Fdoi.org%5C%2F10.3390%5C%2Frs13020325%26lt%3B%5C%2Fa%26gt%3B%20%26lt%3Ba%20title%3D%26%23039%3BCite%20in%20RIS%20Format%26%23039%3B%20class%3D%26%23039%3Bzp-CiteRIS%26%23039%3B%20data-zp-cite%3D%26%23039%3Bapi_user_id%3D4800755%26amp%3Bitem_key%3DYMADB83Q%26%23039%3B%20href%3D%26%23039%3Bjavascript%3Avoid%280%29%3B%26%23039%3B%26gt%3BCite%26lt%3B%5C%2Fa%26gt%3B%20%26lt%3B%5C%2Fdiv%26gt%3B%5Cn%26lt%3B%5C%2Fdiv%26gt%3B%22%2C%22data%22%3A%7B%22itemType%22%3A%22journalArticle%22%2C%22title%22%3A%22Predicting%20the%20Presence%20of%20Leptospires%20in%20Rodents%20from%20Environmental%20Indicators%20Opens%20Up%20Opportunities%20for%20Environmental%20Monitoring%20of%20Human%20Leptospirosis%22%2C%22creators%22%3A%5B%7B%22creatorType%22%3A%22author%22%2C%22firstName%22%3A%22Leon%22%2C%22lastName%22%3A%22Biscornet%22%7D%2C%7B%22creatorType%22%3A%22author%22%2C%22firstName%22%3A%22Christophe%22%2C%22lastName%22%3A%22R%5Cu00e9villion%22%7D%2C%7B%22creatorType%22%3A%22author%22%2C%22firstName%22%3A%22Sylvaine%22%2C%22lastName%22%3A%22J%5Cu00e9go%22%7D%2C%7B%22creatorType%22%3A%22author%22%2C%22firstName%22%3A%22Erwan%22%2C%22lastName%22%3A%22Lagadec%22%7D%2C%7B%22creatorType%22%3A%22author%22%2C%22firstName%22%3A%22Yann%22%2C%22lastName%22%3A%22Gomard%22%7D%2C%7B%22creatorType%22%3A%22author%22%2C%22firstName%22%3A%22Gildas%22%2C%22lastName%22%3A%22Le%20Minter%22%7D%2C%7B%22creatorType%22%3A%22author%22%2C%22firstName%22%3A%22G%5Cu00e9rard%22%2C%22lastName%22%3A%22Rocamora%22%7D%2C%7B%22creatorType%22%3A%22author%22%2C%22firstName%22%3A%22Vanina%22%2C%22lastName%22%3A%22Guernier-Cambert%22%7D%2C%7B%22creatorType%22%3A%22author%22%2C%22firstName%22%3A%22Julien%22%2C%22lastName%22%3A%22M%5Cu00e9lade%22%7D%2C%7B%22creatorType%22%3A%22author%22%2C%22firstName%22%3A%22Koussay%22%2C%22lastName%22%3A%22Dellagi%22%7D%2C%7B%22creatorType%22%3A%22author%22%2C%22firstName%22%3A%22Pablo%22%2C%22lastName%22%3A%22Tortosa%22%7D%2C%7B%22creatorType%22%3A%22author%22%2C%22firstName%22%3A%22Vincent%22%2C%22lastName%22%3A%22Herbreteau%22%7D%5D%2C%22abstractNote%22%3A%22Leptospirosis%2C%20an%20environmental%20infectious%20disease%20of%20bacterial%20origin%2C%20is%20the%20infectious%20disease%20with%20the%20highest%20associated%20mortality%20in%20Seychelles.%20In%20small%20island%20territories%2C%20the%20occurrence%20of%20the%20disease%20is%20spatially%20heterogeneous%20and%20a%20better%20understanding%20of%20the%20environmental%20factors%20that%20contribute%20to%20the%20presence%20of%20the%20bacteria%20would%20help%20implement%20targeted%20control.%20The%20present%20study%20aimed%20at%20identifying%20the%20main%20environmental%20parameters%20correlated%20with%20animal%20reservoirs%20distribution%20and%20Leptospira%20infection%20in%20order%20to%20delineate%20habitats%20with%20highest%20prevalence.%20We%20used%20a%20previously%20published%20dataset%20produced%20from%20a%20large%20collection%20of%20rodents%20trapped%20during%20the%20dry%20and%20wet%20seasons%20in%20most%20habitats%20of%20Mah%5Cu00e9%2C%20the%20main%20island%20of%20Seychelles.%20A%20land%20use%5C%2Fland%20cover%20analysis%20was%20realized%20in%20order%20to%20describe%20the%20various%20environments%20using%20SPOT-5%20images%20by%20remote%20sensing%20%28object-based%20image%20analysis%29.%20At%20each%20sampling%20site%2C%20landscape%20indices%20were%20calculated%20and%20combined%20with%20other%20geographical%20parameters%20together%20with%20rainfall%20records%20to%20be%20used%20in%20a%20multivariate%20statistical%20analysis.%20Several%20environmental%20factors%20were%20found%20to%20be%20associated%20with%20the%20carriage%20of%20leptospires%20in%20Rattus%20rattus%20and%20Rattus%20norvegicus%2C%20namely%20low%20elevations%2C%20fragmented%20landscapes%2C%20the%20proximity%20of%20urbanized%20areas%2C%20an%20increased%20distance%20from%20forests%20and%2C%20above%20all%2C%20increased%20precipitation%20in%20the%20three%20months%20preceding%20trapping.%20The%20analysis%20indicated%20that%20Leptospira%20renal%20carriage%20could%20be%20predicted%20using%20the%20species%20identification%20and%20a%20description%20of%20landscape%20fragmentation%20and%20rainfall%2C%20with%20infection%20prevalence%20being%20positively%20correlated%20with%20these%20two%20environmental%20variables.%20This%20model%20may%20help%20decision%20makers%20in%20implementing%20policies%20affecting%20urban%20landscapes%20and%5C%2For%20in%20balancing%20conservation%20efforts%20when%20designing%20pest%20control%20strategies%20that%20should%20also%20aim%20at%20reducing%20human%20contact%20with%20Leptospira-laden%20rats%20while%20limiting%20their%20impact%20on%20the%20autochthonous%20fauna.%22%2C%22date%22%3A%222021-01-19%22%2C%22section%22%3A%22%22%2C%22partNumber%22%3A%22%22%2C%22partTitle%22%3A%22%22%2C%22DOI%22%3A%2210.3390%5C%2Frs13020325%22%2C%22citationKey%22%3A%22%22%2C%22url%22%3A%22https%3A%5C%2F%5C%2Fwww.mdpi.com%5C%2F2072-4292%5C%2F13%5C%2F2%5C%2F325%22%2C%22PMID%22%3A%22%22%2C%22PMCID%22%3A%22%22%2C%22ISSN%22%3A%222072-4292%22%2C%22language%22%3A%22en%22%2C%22collections%22%3A%5B%5D%2C%22dateModified%22%3A%222022-10-03T02%3A03%3A59Z%22%7D%7D%2C%7B%22key%22%3A%225HWGENK2%22%2C%22library%22%3A%7B%22id%22%3A4800755%7D%2C%22meta%22%3A%7B%22creatorSummary%22%3A%22Garchitorena%20et%20al.%22%2C%22parsedDate%22%3A%222021%22%2C%22numChildren%22%3A0%7D%2C%22bib%22%3A%22%26lt%3Bdiv%20class%3D%26quot%3Bcsl-bib-body%26quot%3B%20style%3D%26quot%3Bline-height%3A%202%3B%20padding-left%3A%201em%3B%20text-indent%3A-1em%3B%26quot%3B%26gt%3B%5Cn%20%20%26lt%3Bdiv%20class%3D%26quot%3Bcsl-entry%26quot%3B%26gt%3BGarchitorena%2C%20A.%2C%20Ihantamalala%2C%20F.%20A.%2C%20R%26%23xE9%3Bvillion%2C%20C.%2C%20Cordier%2C%20L.%20F.%2C%20Randriamihaja%2C%20M.%2C%20Razafinjato%2C%20B.%2C%20Rafenoarivamalala%2C%20F.%20H.%2C%20Finnegan%2C%20K.%20E.%2C%20Andrianirinarison%2C%20J.%20C.%2C%20Rakotonirina%2C%20J.%2C%20Herbreteau%2C%20V.%2C%20%26amp%3B%20Bonds%2C%20M.%20H.%20%282021%29.%20Geographic%20barriers%20to%20achieving%20universal%20health%20coverage%3A%20evidence%20from%20rural%20Madagascar.%20%26lt%3Bi%26gt%3BHealth%20Policy%20and%20Planning%26lt%3B%5C%2Fi%26gt%3B%2C%20%26lt%3Bi%26gt%3Bczab087%26lt%3B%5C%2Fi%26gt%3B.%20%26lt%3Ba%20class%3D%26%23039%3Bzp-ItemURL%26%23039%3B%20target%3D%26%23039%3B_blank%26%23039%3B%20href%3D%26%23039%3Bhttps%3A%5C%2F%5C%2Fdoi.org%5C%2F10.1093%5C%2Fheapol%5C%2Fczab087%26%23039%3B%26gt%3Bhttps%3A%5C%2F%5C%2Fdoi.org%5C%2F10.1093%5C%2Fheapol%5C%2Fczab087%26lt%3B%5C%2Fa%26gt%3B%20%26lt%3Ba%20title%3D%26%23039%3BCite%20in%20RIS%20Format%26%23039%3B%20class%3D%26%23039%3Bzp-CiteRIS%26%23039%3B%20data-zp-cite%3D%26%23039%3Bapi_user_id%3D4800755%26amp%3Bitem_key%3D5HWGENK2%26%23039%3B%20href%3D%26%23039%3Bjavascript%3Avoid%280%29%3B%26%23039%3B%26gt%3BCite%26lt%3B%5C%2Fa%26gt%3B%20%26lt%3B%5C%2Fdiv%26gt%3B%5Cn%26lt%3B%5C%2Fdiv%26gt%3B%22%2C%22data%22%3A%7B%22itemType%22%3A%22journalArticle%22%2C%22title%22%3A%22Geographic%20barriers%20to%20achieving%20universal%20health%20coverage%3A%20evidence%20from%20rural%20Madagascar%22%2C%22creators%22%3A%5B%7B%22creatorType%22%3A%22author%22%2C%22firstName%22%3A%22Andres%22%2C%22lastName%22%3A%22Garchitorena%22%7D%2C%7B%22creatorType%22%3A%22author%22%2C%22firstName%22%3A%22Felana%20A%22%2C%22lastName%22%3A%22Ihantamalala%22%7D%2C%7B%22creatorType%22%3A%22author%22%2C%22firstName%22%3A%22Christophe%22%2C%22lastName%22%3A%22R%5Cu00e9villion%22%7D%2C%7B%22creatorType%22%3A%22author%22%2C%22firstName%22%3A%22Laura%20F%22%2C%22lastName%22%3A%22Cordier%22%7D%2C%7B%22creatorType%22%3A%22author%22%2C%22firstName%22%3A%22Mauricianot%22%2C%22lastName%22%3A%22Randriamihaja%22%7D%2C%7B%22creatorType%22%3A%22author%22%2C%22firstName%22%3A%22Benedicte%22%2C%22lastName%22%3A%22Razafinjato%22%7D%2C%7B%22creatorType%22%3A%22author%22%2C%22firstName%22%3A%22Feno%20H%22%2C%22lastName%22%3A%22Rafenoarivamalala%22%7D%2C%7B%22creatorType%22%3A%22author%22%2C%22firstName%22%3A%22Karen%20E%22%2C%22lastName%22%3A%22Finnegan%22%7D%2C%7B%22creatorType%22%3A%22author%22%2C%22firstName%22%3A%22Jean%20Claude%22%2C%22lastName%22%3A%22Andrianirinarison%22%7D%2C%7B%22creatorType%22%3A%22author%22%2C%22firstName%22%3A%22Julio%22%2C%22lastName%22%3A%22Rakotonirina%22%7D%2C%7B%22creatorType%22%3A%22author%22%2C%22firstName%22%3A%22Vincent%22%2C%22lastName%22%3A%22Herbreteau%22%7D%2C%7B%22creatorType%22%3A%22author%22%2C%22firstName%22%3A%22Matthew%20H%22%2C%22lastName%22%3A%22Bonds%22%7D%5D%2C%22abstractNote%22%3A%22Poor%20geographic%20access%20can%20persist%20even%20when%20affordable%20and%20well-functioning%20health%20systems%20are%20in%20place%2C%20limiting%20efforts%20for%20universal%20health%20coverage%20%28UHC%29.%20It%20is%20unclear%20how%20to%20balance%20support%20for%20health%20facilities%20and%20community%20health%20workers%20in%20UHC%20national%20strategies.%20The%20goal%20of%20this%20study%20was%20to%20evaluate%20how%20a%20health%20system%20strengthening%20%28HSS%29%20intervention%20aimed%20towards%20UHC%20affected%20the%20geographic%20access%20to%20primary%20care%20in%20a%20rural%20district%20of%20Madagascar.%20For%20this%2C%20we%20collected%20the%20fokontany%20of%20residence%20%28lowest%20administrative%20unit%29%20from%20nearly%20300%20000%20outpatient%20consultations%20occurring%20in%20facilities%20of%20Ifanadiana%20district%20in%202014%5Cu20132017%20and%20in%20the%20subset%20of%20community%20sites%20supported%20by%20the%20HSS%20intervention.%20Distance%20from%20patients%20to%20facilities%20was%20accurately%20estimated%20following%20a%20full%20mapping%20of%20the%20district%5Cu2019s%20footpaths%20and%20residential%20areas.%20We%20modelled%20per%20capita%20utilization%20for%20each%20fokontany%20through%20interrupted%20time-series%20analyses%20with%20control%20groups%2C%20accounting%20for%20non-linear%20relationships%20with%20distance%20and%20travel%20time%20among%20other%20factors%2C%20and%20we%20predicted%20facility%20utilization%20across%20the%20district%20under%20a%20scenario%20with%20and%20without%20HSS.%20Finally%2C%20we%20compared%20geographic%20trends%20in%20primary%20care%20when%20combining%20utilization%20at%20health%20facilities%20and%20community%20sites.%20We%20find%20that%20facility-based%20interventions%20similar%20to%20those%20in%20UHC%20strategies%20achieved%20high%20utilization%20rates%20of%201%5Cu20133%20consultations%20per%20person%20year%20only%20among%20populations%20living%20in%20close%20proximity%20to%20facilities.%20We%20predict%20that%20scaling%20only%20facility-based%20HSS%20programmes%20would%20result%20in%20large%20gaps%20in%20access%2C%20with%20over%2075%25%20of%20the%20population%20unable%20to%20reach%20one%20consultation%20per%20person%20year.%20Community%20health%20delivery%2C%20available%20only%20for%20children%20under%205%5Cu2009years%2C%20provided%20major%20improvements%20in%20service%20utilization%20regardless%20of%20their%20distance%20from%20facilities%2C%20contributing%20to%2090%25%20of%20primary%20care%20consultations%20in%20remote%20populations.%20Our%20results%20reveal%20the%20geographic%20limits%20of%20current%20UHC%20strategies%20and%20highlight%20the%20need%20to%20invest%20on%20professionalized%20community%20health%20programmes%20with%20larger%20scopes%20of%20service.%22%2C%22date%22%3A%22juillet%2031%2C%202021%22%2C%22section%22%3A%22%22%2C%22partNumber%22%3A%22%22%2C%22partTitle%22%3A%22%22%2C%22DOI%22%3A%2210.1093%5C%2Fheapol%5C%2Fczab087%22%2C%22citationKey%22%3A%22%22%2C%22url%22%3A%22https%3A%5C%2F%5C%2Fdoi.org%5C%2F10.1093%5C%2Fheapol%5C%2Fczab087%22%2C%22PMID%22%3A%22%22%2C%22PMCID%22%3A%22%22%2C%22ISSN%22%3A%220268-1080%22%2C%22language%22%3A%22%22%2C%22collections%22%3A%5B%5D%2C%22dateModified%22%3A%222022-10-03T02%3A03%3A59Z%22%7D%7D%2C%7B%22key%22%3A%226DRF69EN%22%2C%22library%22%3A%7B%22id%22%3A4800755%7D%2C%22meta%22%3A%7B%22creatorSummary%22%3A%22Legendre%20et%20al.%22%2C%22parsedDate%22%3A%222021%22%2C%22numChildren%22%3A0%7D%2C%22bib%22%3A%22%26lt%3Bdiv%20class%3D%26quot%3Bcsl-bib-body%26quot%3B%20style%3D%26quot%3Bline-height%3A%202%3B%20padding-left%3A%201em%3B%20text-indent%3A-1em%3B%26quot%3B%26gt%3B%5Cn%20%20%26lt%3Bdiv%20class%3D%26quot%3Bcsl-entry%26quot%3B%26gt%3BLegendre%2C%20E.%2C%20Landier%2C%20J.%2C%20Lehot%2C%20L.%2C%20Dieng%2C%20S.%2C%20Thu%2C%20A.%2C%20Drae%2C%20J.%2C%20Delmas%2C%20G.%2C%20Girond%2C%20F.%2C%20Herbreteau%2C%20V.%2C%20Nosten%2C%20F.%2C%20%26amp%3B%20Gaudart%2C%20J.%20%282021%29.%20Classification%20de%20dynamiques%20temporelles%20de%20paludisme%20%26%23xE0%3B%20l%26%23x2019%3B%26%23xE9%3Bchelle%20du%20village%20dans%20le%20cadre%20d%26%23x2019%3Bun%20programme%20d%26%23x2019%3B%26%23xE9%3Blimination%20du%20paludisme.%20%26lt%3Bi%26gt%3BRevue%20d%26%23x2019%3B%26%23xC9%3Bpid%26%23xE9%3Bmiologie%20et%20de%20Sant%26%23xE9%3B%20Publique%26lt%3B%5C%2Fi%26gt%3B%2C%20%26lt%3Bi%26gt%3B69%26lt%3B%5C%2Fi%26gt%3B%2C%20S20.%20%26lt%3Ba%20class%3D%26%23039%3Bzp-DOIURL%26%23039%3B%20target%3D%26%23039%3B_blank%26%23039%3B%20href%3D%26%23039%3Bhttps%3A%5C%2F%5C%2Fdoi.org%5C%2F10.1016%5C%2Fj.respe.2021.04.032%26%23039%3B%26gt%3Bhttps%3A%5C%2F%5C%2Fdoi.org%5C%2F10.1016%5C%2Fj.respe.2021.04.032%26lt%3B%5C%2Fa%26gt%3B%20%26lt%3Ba%20title%3D%26%23039%3BCite%20in%20RIS%20Format%26%23039%3B%20class%3D%26%23039%3Bzp-CiteRIS%26%23039%3B%20data-zp-cite%3D%26%23039%3Bapi_user_id%3D4800755%26amp%3Bitem_key%3D6DRF69EN%26%23039%3B%20href%3D%26%23039%3Bjavascript%3Avoid%280%29%3B%26%23039%3B%26gt%3BCite%26lt%3B%5C%2Fa%26gt%3B%20%26lt%3B%5C%2Fdiv%26gt%3B%5Cn%26lt%3B%5C%2Fdiv%26gt%3B%22%2C%22data%22%3A%7B%22itemType%22%3A%22journalArticle%22%2C%22title%22%3A%22Classification%20de%20dynamiques%20temporelles%20de%20paludisme%20%5Cu00e0%20l%5Cu2019%5Cu00e9chelle%20du%20village%20dans%20le%20cadre%20d%5Cu2019un%20programme%20d%5Cu2019%5Cu00e9limination%20du%20paludisme%22%2C%22creators%22%3A%5B%7B%22creatorType%22%3A%22author%22%2C%22firstName%22%3A%22E.%22%2C%22lastName%22%3A%22Legendre%22%7D%2C%7B%22creatorType%22%3A%22author%22%2C%22firstName%22%3A%22J.%22%2C%22lastName%22%3A%22Landier%22%7D%2C%7B%22creatorType%22%3A%22author%22%2C%22firstName%22%3A%22L.%22%2C%22lastName%22%3A%22Lehot%22%7D%2C%7B%22creatorType%22%3A%22author%22%2C%22firstName%22%3A%22S.%22%2C%22lastName%22%3A%22Dieng%22%7D%2C%7B%22creatorType%22%3A%22author%22%2C%22firstName%22%3A%22A.%22%2C%22lastName%22%3A%22Thu%22%7D%2C%7B%22creatorType%22%3A%22author%22%2C%22firstName%22%3A%22J.%22%2C%22lastName%22%3A%22Drae%22%7D%2C%7B%22creatorType%22%3A%22author%22%2C%22firstName%22%3A%22G.%22%2C%22lastName%22%3A%22Delmas%22%7D%2C%7B%22creatorType%22%3A%22author%22%2C%22firstName%22%3A%22F.%22%2C%22lastName%22%3A%22Girond%22%7D%2C%7B%22creatorType%22%3A%22author%22%2C%22firstName%22%3A%22V.%22%2C%22lastName%22%3A%22Herbreteau%22%7D%2C%7B%22creatorType%22%3A%22author%22%2C%22firstName%22%3A%22F.%22%2C%22lastName%22%3A%22Nosten%22%7D%2C%7B%22creatorType%22%3A%22author%22%2C%22firstName%22%3A%22J.%22%2C%22lastName%22%3A%22Gaudart%22%7D%5D%2C%22abstractNote%22%3A%22%22%2C%22date%22%3A%2206%5C%2F2021%22%2C%22section%22%3A%22%22%2C%22partNumber%22%3A%22%22%2C%22partTitle%22%3A%22%22%2C%22DOI%22%3A%2210.1016%5C%2Fj.respe.2021.04.032%22%2C%22citationKey%22%3A%22%22%2C%22url%22%3A%22https%3A%5C%2F%5C%2Flinkinghub.elsevier.com%5C%2Fretrieve%5C%2Fpii%5C%2FS0398762021001097%22%2C%22PMID%22%3A%22%22%2C%22PMCID%22%3A%22%22%2C%22ISSN%22%3A%2203987620%22%2C%22language%22%3A%22fr%22%2C%22collections%22%3A%5B%5D%2C%22dateModified%22%3A%222022-10-03T02%3A03%3A59Z%22%7D%7D%2C%7B%22key%22%3A%22W8YUKKYA%22%2C%22library%22%3A%7B%22id%22%3A4800755%7D%2C%22meta%22%3A%7B%22creatorSummary%22%3A%22Attoumane%20et%20al.%22%2C%22parsedDate%22%3A%222020-12-13%22%2C%22numChildren%22%3A0%7D%2C%22bib%22%3A%22%26lt%3Bdiv%20class%3D%26quot%3Bcsl-bib-body%26quot%3B%20style%3D%26quot%3Bline-height%3A%202%3B%20padding-left%3A%201em%3B%20text-indent%3A-1em%3B%26quot%3B%26gt%3B%5Cn%20%20%26lt%3Bdiv%20class%3D%26quot%3Bcsl-entry%26quot%3B%26gt%3BAttoumane%2C%20A.%2C%20Silai%2C%20R.%2C%20Bacar%2C%20A.%2C%20Cardinale%2C%20E.%2C%20Pennober%2C%20G.%2C%20%26amp%3B%20Herbreteau%2C%20V.%20%282020%29.%20Changing%20Patterns%20of%20Malaria%20in%20Grande%20Comore%20after%20a%20Drastic%20Decline%3A%20Importance%20of%20Fine-Scale%20Spatial%20Analysis%20to%20Inform%20Future%20Control%20Actions.%20%26lt%3Bi%26gt%3BRemote%20Sensing%26lt%3B%5C%2Fi%26gt%3B%2C%20%26lt%3Bi%26gt%3B12%26lt%3B%5C%2Fi%26gt%3B%2824%29%2C%204082.%20%26lt%3Ba%20class%3D%26%23039%3Bzp-DOIURL%26%23039%3B%20target%3D%26%23039%3B_blank%26%23039%3B%20href%3D%26%23039%3Bhttps%3A%5C%2F%5C%2Fdoi.org%5C%2F10.3390%5C%2Frs12244082%26%23039%3B%26gt%3Bhttps%3A%5C%2F%5C%2Fdoi.org%5C%2F10.3390%5C%2Frs12244082%26lt%3B%5C%2Fa%26gt%3B%20%26lt%3Ba%20title%3D%26%23039%3BCite%20in%20RIS%20Format%26%23039%3B%20class%3D%26%23039%3Bzp-CiteRIS%26%23039%3B%20data-zp-cite%3D%26%23039%3Bapi_user_id%3D4800755%26amp%3Bitem_key%3DW8YUKKYA%26%23039%3B%20href%3D%26%23039%3Bjavascript%3Avoid%280%29%3B%26%23039%3B%26gt%3BCite%26lt%3B%5C%2Fa%26gt%3B%20%26lt%3B%5C%2Fdiv%26gt%3B%5Cn%26lt%3B%5C%2Fdiv%26gt%3B%22%2C%22data%22%3A%7B%22itemType%22%3A%22journalArticle%22%2C%22title%22%3A%22Changing%20Patterns%20of%20Malaria%20in%20Grande%20Comore%20after%20a%20Drastic%20Decline%3A%20Importance%20of%20Fine-Scale%20Spatial%20Analysis%20to%20Inform%20Future%20Control%20Actions%22%2C%22creators%22%3A%5B%7B%22creatorType%22%3A%22author%22%2C%22firstName%22%3A%22Artadji%22%2C%22lastName%22%3A%22Attoumane%22%7D%2C%7B%22creatorType%22%3A%22author%22%2C%22firstName%22%3A%22Rahamatou%22%2C%22lastName%22%3A%22Silai%22%7D%2C%7B%22creatorType%22%3A%22author%22%2C%22firstName%22%3A%22Affane%22%2C%22lastName%22%3A%22Bacar%22%7D%2C%7B%22creatorType%22%3A%22author%22%2C%22firstName%22%3A%22Eric%22%2C%22lastName%22%3A%22Cardinale%22%7D%2C%7B%22creatorType%22%3A%22author%22%2C%22firstName%22%3A%22Gwena%5Cu00eblle%22%2C%22lastName%22%3A%22Pennober%22%7D%2C%7B%22creatorType%22%3A%22author%22%2C%22firstName%22%3A%22Vincent%22%2C%22lastName%22%3A%22Herbreteau%22%7D%5D%2C%22abstractNote%22%3A%22Malaria%20has%20long%20been%20endemic%20in%20the%20Union%20of%20Comoros%20reaching%20an%20incidence%20of%2015%2C045%20cases%20for%20100%2C000%20inhabitants%20in%202010%20%28103%2C670%20cases%29.%20Since%20then%2C%20strengthened%20control%20actions%20based%20on%20the%20distribution%20of%20Long-Lasting%20Insecticidal%20mosquito%20Nets%20and%20mass%20treatment%20have%20reduced%20malaria%20to%20a%20low%20level.%20However%2C%20it%20persists%20more%20specifically%20in%20Grande%20Comore%2C%20where%2082%25%20of%20cases%20were%20diagnosed%20between%202010%20and%202016.%20This%20situation%20remains%20a%20challenge%20for%20health%20authorities%20seeking%20to%20eliminate%20malaria%2C%20by%20targeting%20transmission%20sites%20more%20precisely.%20In%20this%20context%2C%20this%20study%20aimed%20at%20mapping%20malaria%20at%20the%20finest%20scale%2C%20in%20order%20to%20describe%20its%20spatial%20distribution%20and%20identify%20possible%20environmental%20indicators.%20The%20National%20Malaria%20Control%20Program%20provided%20the%202016%20data%2C%20the%20only%20year%20that%20could%20be%20mapped%20at%20the%20level%20of%20localities.%20This%20mapping%20revealed%20spatial%20autocorrelation%20between%20localities%2C%20especially%20in%20the%20east%20of%20the%20island%20with%20a%20major%20cluster%20around%20Itsinkoudi%20%28using%20the%20Kulldorff%5Cu2019s%20spatial%20scan%20test%29.%20Secondary%20clusters%20showed%20that%20malaria%20remains%20present%20throughout%20the%20island%20in%20both%20rural%20and%20urban%20areas.%20We%20also%20analyzed%20satellite%20images%20%28SPOT%205%29%20with%20remote%20sensing%20techniques%20%28Object-Based%20Image%20Analysis%29%20to%20look%20for%20environmental%20indicators.%20Landscape%20analysis%20shows%20that%20malaria%20incidence%20is%20correlated%20across%20the%20island%20with%20low%20altitudes%2C%20and%20a%20larger%20proportion%20of%20grasslands%20or%20a%20fewer%20proportion%20of%20forested%20areas%20nearby%20%28at%20less%20than%201km%20around%20villages%29.%20More%20locally%20in%20the%20east%2C%20malaria%20is%20linked%20to%20larger%20shrub%20areas.%20These%20relationships%20could%20be%20associated%20with%20the%20fact%20that%20lower%20altitude%20localities%20are%20more%20interconnected%2C%20such%20facilitating%20malaria%20transmission.%20In%202016%2C%20malaria%20persists%20in%20Grande%20Comore%2C%20showing%20new%20patterns%20with%20more%20cases%20in%20the%20eastern%20part%20of%20the%20island%20and%20the%20possibility%20of%20high%20incidences%20during%20the%20dry%20season.%20Precise%20mapping%20of%20epidemiological%20data%20and%20landscape%20analysis%20allow%20the%20identification%20of%20clusters%20and%20active%20transmission%20foci.%20They%20are%20important%20tools%20for%20health%20surveillance%20in%20order%20to%20optimize%20control%20actions%20on%20key%20transmission%20locations.%22%2C%22date%22%3A%222020-12-13%22%2C%22section%22%3A%22%22%2C%22partNumber%22%3A%22%22%2C%22partTitle%22%3A%22%22%2C%22DOI%22%3A%2210.3390%5C%2Frs12244082%22%2C%22citationKey%22%3A%22%22%2C%22url%22%3A%22https%3A%5C%2F%5C%2Fwww.mdpi.com%5C%2F2072-4292%5C%2F12%5C%2F24%5C%2F4082%22%2C%22PMID%22%3A%22%22%2C%22PMCID%22%3A%22%22%2C%22ISSN%22%3A%222072-4292%22%2C%22language%22%3A%22en%22%2C%22collections%22%3A%5B%5D%2C%22dateModified%22%3A%222022-10-03T02%3A03%3A59Z%22%7D%7D%2C%7B%22key%22%3A%22C6H7N8BF%22%2C%22library%22%3A%7B%22id%22%3A4800755%7D%2C%22meta%22%3A%7B%22creatorSummary%22%3A%22Pepey%20et%20al.%22%2C%22parsedDate%22%3A%222020-09-12%22%2C%22numChildren%22%3A0%7D%2C%22bib%22%3A%22%26lt%3Bdiv%20class%3D%26quot%3Bcsl-bib-body%26quot%3B%20style%3D%26quot%3Bline-height%3A%202%3B%20padding-left%3A%201em%3B%20text-indent%3A-1em%3B%26quot%3B%26gt%3B%5Cn%20%20%26lt%3Bdiv%20class%3D%26quot%3Bcsl-entry%26quot%3B%26gt%3BPepey%2C%20A.%2C%20Souris%2C%20M.%2C%20Vantaux%2C%20A.%2C%20Morand%2C%20S.%2C%20Lek%2C%20D.%2C%20Mueller%2C%20I.%2C%20Witkowski%2C%20B.%2C%20%26amp%3B%20Herbreteau%2C%20V.%20%282020%29.%20Studying%20Land%20Cover%20Changes%20in%20a%20Malaria-Endemic%20Cambodian%20District%3A%20Considerations%20and%20Constraints.%20%26lt%3Bi%26gt%3BRemote%20Sensing%26lt%3B%5C%2Fi%26gt%3B%2C%20%26lt%3Bi%26gt%3B12%26lt%3B%5C%2Fi%26gt%3B%2818%29%2C%202972.%20%26lt%3Ba%20class%3D%26%23039%3Bzp-DOIURL%26%23039%3B%20target%3D%26%23039%3B_blank%26%23039%3B%20href%3D%26%23039%3Bhttps%3A%5C%2F%5C%2Fdoi.org%5C%2F10.3390%5C%2Frs12182972%26%23039%3B%26gt%3Bhttps%3A%5C%2F%5C%2Fdoi.org%5C%2F10.3390%5C%2Frs12182972%26lt%3B%5C%2Fa%26gt%3B%20%26lt%3Ba%20title%3D%26%23039%3BCite%20in%20RIS%20Format%26%23039%3B%20class%3D%26%23039%3Bzp-CiteRIS%26%23039%3B%20data-zp-cite%3D%26%23039%3Bapi_user_id%3D4800755%26amp%3Bitem_key%3DC6H7N8BF%26%23039%3B%20href%3D%26%23039%3Bjavascript%3Avoid%280%29%3B%26%23039%3B%26gt%3BCite%26lt%3B%5C%2Fa%26gt%3B%20%26lt%3B%5C%2Fdiv%26gt%3B%5Cn%26lt%3B%5C%2Fdiv%26gt%3B%22%2C%22data%22%3A%7B%22itemType%22%3A%22journalArticle%22%2C%22title%22%3A%22Studying%20Land%20Cover%20Changes%20in%20a%20Malaria-Endemic%20Cambodian%20District%3A%20Considerations%20and%20Constraints%22%2C%22creators%22%3A%5B%7B%22creatorType%22%3A%22author%22%2C%22firstName%22%3A%22Ana%5Cu00efs%22%2C%22lastName%22%3A%22Pepey%22%7D%2C%7B%22creatorType%22%3A%22author%22%2C%22firstName%22%3A%22Marc%22%2C%22lastName%22%3A%22Souris%22%7D%2C%7B%22creatorType%22%3A%22author%22%2C%22firstName%22%3A%22Am%5Cu00e9lie%22%2C%22lastName%22%3A%22Vantaux%22%7D%2C%7B%22creatorType%22%3A%22author%22%2C%22firstName%22%3A%22Serge%22%2C%22lastName%22%3A%22Morand%22%7D%2C%7B%22creatorType%22%3A%22author%22%2C%22firstName%22%3A%22Dysoley%22%2C%22lastName%22%3A%22Lek%22%7D%2C%7B%22creatorType%22%3A%22author%22%2C%22firstName%22%3A%22Ivo%22%2C%22lastName%22%3A%22Mueller%22%7D%2C%7B%22creatorType%22%3A%22author%22%2C%22firstName%22%3A%22Benoit%22%2C%22lastName%22%3A%22Witkowski%22%7D%2C%7B%22creatorType%22%3A%22author%22%2C%22firstName%22%3A%22Vincent%22%2C%22lastName%22%3A%22Herbreteau%22%7D%5D%2C%22abstractNote%22%3A%22%22%2C%22date%22%3A%222020-09-12%22%2C%22section%22%3A%22%22%2C%22partNumber%22%3A%22%22%2C%22partTitle%22%3A%22%22%2C%22DOI%22%3A%2210.3390%5C%2Frs12182972%22%2C%22citationKey%22%3A%22%22%2C%22url%22%3A%22https%3A%5C%2F%5C%2Fwww.mdpi.com%5C%2F2072-4292%5C%2F12%5C%2F18%5C%2F2972%22%2C%22PMID%22%3A%22%22%2C%22PMCID%22%3A%22%22%2C%22ISSN%22%3A%222072-4292%22%2C%22language%22%3A%22en%22%2C%22collections%22%3A%5B%5D%2C%22dateModified%22%3A%222022-10-03T02%3A03%3A59Z%22%7D%7D%2C%7B%22key%22%3A%22AP5WHQMB%22%2C%22library%22%3A%7B%22id%22%3A4800755%7D%2C%22meta%22%3A%7B%22creatorSummary%22%3A%22Marti%20et%20al.%22%2C%22parsedDate%22%3A%222020-03-13%22%2C%22numChildren%22%3A0%7D%2C%22bib%22%3A%22%26lt%3Bdiv%20class%3D%26quot%3Bcsl-bib-body%26quot%3B%20style%3D%26quot%3Bline-height%3A%202%3B%20padding-left%3A%201em%3B%20text-indent%3A-1em%3B%26quot%3B%26gt%3B%5Cn%20%20%26lt%3Bdiv%20class%3D%26quot%3Bcsl-entry%26quot%3B%26gt%3BMarti%2C%20R.%2C%20Li%2C%20Z.%2C%20Catry%2C%20T.%2C%20Roux%2C%20E.%2C%20Mangeas%2C%20M.%2C%20Handschumacher%2C%20P.%2C%20Gaudart%2C%20J.%2C%20Tran%2C%20A.%2C%20Demagistri%2C%20L.%2C%20Faure%2C%20J.-F.%2C%20Carvajal%2C%20J.%20J.%2C%20Drumond%2C%20B.%2C%20Xu%2C%20L.%2C%20Herbreteau%2C%20V.%2C%20Gurgel%2C%20H.%2C%20Dessay%2C%20N.%2C%20%26amp%3B%20Gong%2C%20P.%20%282020%29.%20A%20Mapping%20Review%20on%20Urban%20Landscape%20Factors%20of%20Dengue%20Retrieved%20from%20Earth%20Observation%20Data%2C%20GIS%20Techniques%2C%20and%20Survey%20Questionnaires.%20%26lt%3Bi%26gt%3BRemote%20Sensing%26lt%3B%5C%2Fi%26gt%3B%2C%20%26lt%3Bi%26gt%3B12%26lt%3B%5C%2Fi%26gt%3B%286%29%2C%20932.%20%26lt%3Ba%20class%3D%26%23039%3Bzp-DOIURL%26%23039%3B%20target%3D%26%23039%3B_blank%26%23039%3B%20href%3D%26%23039%3Bhttps%3A%5C%2F%5C%2Fdoi.org%5C%2F10.3390%5C%2Frs12060932%26%23039%3B%26gt%3Bhttps%3A%5C%2F%5C%2Fdoi.org%5C%2F10.3390%5C%2Frs12060932%26lt%3B%5C%2Fa%26gt%3B%20%26lt%3Ba%20title%3D%26%23039%3BCite%20in%20RIS%20Format%26%23039%3B%20class%3D%26%23039%3Bzp-CiteRIS%26%23039%3B%20data-zp-cite%3D%26%23039%3Bapi_user_id%3D4800755%26amp%3Bitem_key%3DAP5WHQMB%26%23039%3B%20href%3D%26%23039%3Bjavascript%3Avoid%280%29%3B%26%23039%3B%26gt%3BCite%26lt%3B%5C%2Fa%26gt%3B%20%26lt%3B%5C%2Fdiv%26gt%3B%5Cn%26lt%3B%5C%2Fdiv%26gt%3B%22%2C%22data%22%3A%7B%22itemType%22%3A%22journalArticle%22%2C%22title%22%3A%22A%20Mapping%20Review%20on%20Urban%20Landscape%20Factors%20of%20Dengue%20Retrieved%20from%20Earth%20Observation%20Data%2C%20GIS%20Techniques%2C%20and%20Survey%20Questionnaires%22%2C%22creators%22%3A%5B%7B%22creatorType%22%3A%22author%22%2C%22firstName%22%3A%22Renaud%22%2C%22lastName%22%3A%22Marti%22%7D%2C%7B%22creatorType%22%3A%22author%22%2C%22firstName%22%3A%22Zhichao%22%2C%22lastName%22%3A%22Li%22%7D%2C%7B%22creatorType%22%3A%22author%22%2C%22firstName%22%3A%22Thibault%22%2C%22lastName%22%3A%22Catry%22%7D%2C%7B%22creatorType%22%3A%22author%22%2C%22firstName%22%3A%22Emmanuel%22%2C%22lastName%22%3A%22Roux%22%7D%2C%7B%22creatorType%22%3A%22author%22%2C%22firstName%22%3A%22Morgan%22%2C%22lastName%22%3A%22Mangeas%22%7D%2C%7B%22creatorType%22%3A%22author%22%2C%22firstName%22%3A%22Pascal%22%2C%22lastName%22%3A%22Handschumacher%22%7D%2C%7B%22creatorType%22%3A%22author%22%2C%22firstName%22%3A%22Jean%22%2C%22lastName%22%3A%22Gaudart%22%7D%2C%7B%22creatorType%22%3A%22author%22%2C%22firstName%22%3A%22Annelise%22%2C%22lastName%22%3A%22Tran%22%7D%2C%7B%22creatorType%22%3A%22author%22%2C%22firstName%22%3A%22Laurent%22%2C%22lastName%22%3A%22Demagistri%22%7D%2C%7B%22creatorType%22%3A%22author%22%2C%22firstName%22%3A%22Jean-Fran%5Cu00e7ois%22%2C%22lastName%22%3A%22Faure%22%7D%2C%7B%22creatorType%22%3A%22author%22%2C%22firstName%22%3A%22Jos%5Cu00e9%20Joaqu%5Cu00edn%22%2C%22lastName%22%3A%22Carvajal%22%7D%2C%7B%22creatorType%22%3A%22author%22%2C%22firstName%22%3A%22Bruna%22%2C%22lastName%22%3A%22Drumond%22%7D%2C%7B%22creatorType%22%3A%22author%22%2C%22firstName%22%3A%22Lei%22%2C%22lastName%22%3A%22Xu%22%7D%2C%7B%22creatorType%22%3A%22author%22%2C%22firstName%22%3A%22Vincent%22%2C%22lastName%22%3A%22Herbreteau%22%7D%2C%7B%22creatorType%22%3A%22author%22%2C%22firstName%22%3A%22Helen%22%2C%22lastName%22%3A%22Gurgel%22%7D%2C%7B%22creatorType%22%3A%22author%22%2C%22firstName%22%3A%22Nadine%22%2C%22lastName%22%3A%22Dessay%22%7D%2C%7B%22creatorType%22%3A%22author%22%2C%22firstName%22%3A%22Peng%22%2C%22lastName%22%3A%22Gong%22%7D%5D%2C%22abstractNote%22%3A%22%22%2C%22date%22%3A%222020-03-13%22%2C%22section%22%3A%22%22%2C%22partNumber%22%3A%22%22%2C%22partTitle%22%3A%22%22%2C%22DOI%22%3A%2210.3390%5C%2Frs12060932%22%2C%22citationKey%22%3A%22%22%2C%22url%22%3A%22https%3A%5C%2F%5C%2Fwww.mdpi.com%5C%2F2072-4292%5C%2F12%5C%2F6%5C%2F932%22%2C%22PMID%22%3A%22%22%2C%22PMCID%22%3A%22%22%2C%22ISSN%22%3A%222072-4292%22%2C%22language%22%3A%22en%22%2C%22collections%22%3A%5B%5D%2C%22dateModified%22%3A%222022-10-03T02%3A03%3A59Z%22%7D%7D%2C%7B%22key%22%3A%22WY9CRZ66%22%2C%22library%22%3A%7B%22id%22%3A4800755%7D%2C%22meta%22%3A%7B%22creatorSummary%22%3A%22Tran%20et%20al.%22%2C%22parsedDate%22%3A%222020-01-17%22%2C%22numChildren%22%3A0%7D%2C%22bib%22%3A%22%26lt%3Bdiv%20class%3D%26quot%3Bcsl-bib-body%26quot%3B%20style%3D%26quot%3Bline-height%3A%202%3B%20padding-left%3A%201em%3B%20text-indent%3A-1em%3B%26quot%3B%26gt%3B%5Cn%20%20%26lt%3Bdiv%20class%3D%26quot%3Bcsl-entry%26quot%3B%26gt%3BTran%2C%20A.%2C%20Mangeas%2C%20M.%2C%20Demarchi%2C%20M.%2C%20Roux%2C%20E.%2C%20Degenne%2C%20P.%2C%20Haramboure%2C%20M.%2C%20Le%20Goff%2C%20G.%2C%20Damiens%2C%20D.%2C%20Gouagna%2C%20L.-C.%2C%20Herbreteau%2C%20V.%2C%20%26amp%3B%20Dehecq%2C%20J.-S.%20%282020%29.%20Complementarity%20of%20empirical%20and%20process-based%20approaches%20to%20modelling%20mosquito%20population%20dynamics%20with%20Aedes%20albopictus%20as%20an%20example%26%23x2014%3BApplication%20to%20the%20development%20of%20an%20operational%20mapping%20tool%20of%20vector%20populations.%20%26lt%3Bi%26gt%3BPLOS%20ONE%26lt%3B%5C%2Fi%26gt%3B%2C%20%26lt%3Bi%26gt%3B15%26lt%3B%5C%2Fi%26gt%3B%281%29%2C%20e0227407.%20%26lt%3Ba%20class%3D%26%23039%3Bzp-DOIURL%26%23039%3B%20target%3D%26%23039%3B_blank%26%23039%3B%20href%3D%26%23039%3Bhttps%3A%5C%2F%5C%2Fdoi.org%5C%2F10.1371%5C%2Fjournal.pone.0227407%26%23039%3B%26gt%3Bhttps%3A%5C%2F%5C%2Fdoi.org%5C%2F10.1371%5C%2Fjournal.pone.0227407%26lt%3B%5C%2Fa%26gt%3B%20%26lt%3Ba%20title%3D%26%23039%3BCite%20in%20RIS%20Format%26%23039%3B%20class%3D%26%23039%3Bzp-CiteRIS%26%23039%3B%20data-zp-cite%3D%26%23039%3Bapi_user_id%3D4800755%26amp%3Bitem_key%3DWY9CRZ66%26%23039%3B%20href%3D%26%23039%3Bjavascript%3Avoid%280%29%3B%26%23039%3B%26gt%3BCite%26lt%3B%5C%2Fa%26gt%3B%20%26lt%3B%5C%2Fdiv%26gt%3B%5Cn%26lt%3B%5C%2Fdiv%26gt%3B%22%2C%22data%22%3A%7B%22itemType%22%3A%22journalArticle%22%2C%22title%22%3A%22Complementarity%20of%20empirical%20and%20process-based%20approaches%20to%20modelling%20mosquito%20population%20dynamics%20with%20Aedes%20albopictus%20as%20an%20example%5Cu2014Application%20to%20the%20development%20of%20an%20operational%20mapping%20tool%20of%20vector%20populations%22%2C%22creators%22%3A%5B%7B%22creatorType%22%3A%22author%22%2C%22firstName%22%3A%22Annelise%22%2C%22lastName%22%3A%22Tran%22%7D%2C%7B%22creatorType%22%3A%22author%22%2C%22firstName%22%3A%22Morgan%22%2C%22lastName%22%3A%22Mangeas%22%7D%2C%7B%22creatorType%22%3A%22author%22%2C%22firstName%22%3A%22Marie%22%2C%22lastName%22%3A%22Demarchi%22%7D%2C%7B%22creatorType%22%3A%22author%22%2C%22firstName%22%3A%22Emmanuel%22%2C%22lastName%22%3A%22Roux%22%7D%2C%7B%22creatorType%22%3A%22author%22%2C%22firstName%22%3A%22Pascal%22%2C%22lastName%22%3A%22Degenne%22%7D%2C%7B%22creatorType%22%3A%22author%22%2C%22firstName%22%3A%22Marion%22%2C%22lastName%22%3A%22Haramboure%22%7D%2C%7B%22creatorType%22%3A%22author%22%2C%22firstName%22%3A%22Gilbert%22%2C%22lastName%22%3A%22Le%20Goff%22%7D%2C%7B%22creatorType%22%3A%22author%22%2C%22firstName%22%3A%22David%22%2C%22lastName%22%3A%22Damiens%22%7D%2C%7B%22creatorType%22%3A%22author%22%2C%22firstName%22%3A%22Louis-Cl%5Cu00e9ment%22%2C%22lastName%22%3A%22Gouagna%22%7D%2C%7B%22creatorType%22%3A%22author%22%2C%22firstName%22%3A%22Vincent%22%2C%22lastName%22%3A%22Herbreteau%22%7D%2C%7B%22creatorType%22%3A%22author%22%2C%22firstName%22%3A%22Jean-S%5Cu00e9bastien%22%2C%22lastName%22%3A%22Dehecq%22%7D%2C%7B%22creatorType%22%3A%22editor%22%2C%22firstName%22%3A%22Suzanne%22%2C%22lastName%22%3A%22Touzeau%22%7D%5D%2C%22abstractNote%22%3A%22%22%2C%22date%22%3A%222020-1-17%22%2C%22section%22%3A%22%22%2C%22partNumber%22%3A%22%22%2C%22partTitle%22%3A%22%22%2C%22DOI%22%3A%2210.1371%5C%2Fjournal.pone.0227407%22%2C%22citationKey%22%3A%22%22%2C%22url%22%3A%22https%3A%5C%2F%5C%2Fdx.plos.org%5C%2F10.1371%5C%2Fjournal.pone.0227407%22%2C%22PMID%22%3A%22%22%2C%22PMCID%22%3A%22%22%2C%22ISSN%22%3A%221932-6203%22%2C%22language%22%3A%22en%22%2C%22collections%22%3A%5B%5D%2C%22dateModified%22%3A%222022-10-03T02%3A03%3A59Z%22%7D%7D%2C%7B%22key%22%3A%22IBQCQ3FI%22%2C%22library%22%3A%7B%22id%22%3A4800755%7D%2C%22meta%22%3A%7B%22creatorSummary%22%3A%22Ihantamalala%20et%20al.%22%2C%22parsedDate%22%3A%222020%22%2C%22numChildren%22%3A0%7D%2C%22bib%22%3A%22%26lt%3Bdiv%20class%3D%26quot%3Bcsl-bib-body%26quot%3B%20style%3D%26quot%3Bline-height%3A%202%3B%20padding-left%3A%201em%3B%20text-indent%3A-1em%3B%26quot%3B%26gt%3B%5Cn%20%20%26lt%3Bdiv%20class%3D%26quot%3Bcsl-entry%26quot%3B%26gt%3BIhantamalala%2C%20F.%20A.%2C%20Herbreteau%2C%20V.%2C%20R%26%23xE9%3Bvillion%2C%20C.%2C%20Randriamihaja%2C%20M.%2C%20Commins%2C%20J.%2C%20Andr%26%23xE9%3Bambeloson%2C%20T.%2C%20Rafenoarimalala%2C%20F.%20H.%2C%20Randrianambinina%2C%20A.%2C%20Cordier%2C%20L.%20F.%2C%20Bonds%2C%20M.%20H.%2C%20%26amp%3B%20Garchitorena%2C%20A.%20%282020%29.%20Improving%20geographical%20accessibility%20modeling%20for%20operational%20use%20by%20local%20health%20actors.%20%26lt%3Bi%26gt%3BInternational%20Journal%20of%20Health%20Geographics%26lt%3B%5C%2Fi%26gt%3B%2C%20%26lt%3Bi%26gt%3B19%26lt%3B%5C%2Fi%26gt%3B%281%29.%20%26lt%3Ba%20class%3D%26%23039%3Bzp-DOIURL%26%23039%3B%20target%3D%26%23039%3B_blank%26%23039%3B%20href%3D%26%23039%3Bhttps%3A%5C%2F%5C%2Fdoi.org%5C%2F10.1186%5C%2Fs12942-020-00220-6%26%23039%3B%26gt%3Bhttps%3A%5C%2F%5C%2Fdoi.org%5C%2F10.1186%5C%2Fs12942-020-00220-6%26lt%3B%5C%2Fa%26gt%3B%20%26lt%3Ba%20title%3D%26%23039%3BCite%20in%20RIS%20Format%26%23039%3B%20class%3D%26%23039%3Bzp-CiteRIS%26%23039%3B%20data-zp-cite%3D%26%23039%3Bapi_user_id%3D4800755%26amp%3Bitem_key%3DIBQCQ3FI%26%23039%3B%20href%3D%26%23039%3Bjavascript%3Avoid%280%29%3B%26%23039%3B%26gt%3BCite%26lt%3B%5C%2Fa%26gt%3B%20%26lt%3B%5C%2Fdiv%26gt%3B%5Cn%26lt%3B%5C%2Fdiv%26gt%3B%22%2C%22data%22%3A%7B%22itemType%22%3A%22journalArticle%22%2C%22title%22%3A%22Improving%20geographical%20accessibility%20modeling%20for%20operational%20use%20by%20local%20health%20actors%22%2C%22creators%22%3A%5B%7B%22creatorType%22%3A%22author%22%2C%22firstName%22%3A%22Felana%20Angella%22%2C%22lastName%22%3A%22Ihantamalala%22%7D%2C%7B%22creatorType%22%3A%22author%22%2C%22firstName%22%3A%22Vincent%22%2C%22lastName%22%3A%22Herbreteau%22%7D%2C%7B%22creatorType%22%3A%22author%22%2C%22firstName%22%3A%22Christophe%22%2C%22lastName%22%3A%22R%5Cu00e9villion%22%7D%2C%7B%22creatorType%22%3A%22author%22%2C%22firstName%22%3A%22Mauricianot%22%2C%22lastName%22%3A%22Randriamihaja%22%7D%2C%7B%22creatorType%22%3A%22author%22%2C%22firstName%22%3A%22J%5Cu00e9r%5Cu00e9my%22%2C%22lastName%22%3A%22Commins%22%7D%2C%7B%22creatorType%22%3A%22author%22%2C%22firstName%22%3A%22Tanjona%22%2C%22lastName%22%3A%22Andr%5Cu00e9ambeloson%22%7D%2C%7B%22creatorType%22%3A%22author%22%2C%22firstName%22%3A%22Feno%20H.%22%2C%22lastName%22%3A%22Rafenoarimalala%22%7D%2C%7B%22creatorType%22%3A%22author%22%2C%22firstName%22%3A%22Andriamihaja%22%2C%22lastName%22%3A%22Randrianambinina%22%7D%2C%7B%22creatorType%22%3A%22author%22%2C%22firstName%22%3A%22Laura%20F.%22%2C%22lastName%22%3A%22Cordier%22%7D%2C%7B%22creatorType%22%3A%22author%22%2C%22firstName%22%3A%22Matthew%20H.%22%2C%22lastName%22%3A%22Bonds%22%7D%2C%7B%22creatorType%22%3A%22author%22%2C%22firstName%22%3A%22Andres%22%2C%22lastName%22%3A%22Garchitorena%22%7D%5D%2C%22abstractNote%22%3A%22%22%2C%22date%22%3A%2212%5C%2F2020%22%2C%22section%22%3A%22%22%2C%22partNumber%22%3A%22%22%2C%22partTitle%22%3A%22%22%2C%22DOI%22%3A%2210.1186%5C%2Fs12942-020-00220-6%22%2C%22citationKey%22%3A%22%22%2C%22url%22%3A%22https%3A%5C%2F%5C%2Fij-healthgeographics.biomedcentral.com%5C%2Farticles%5C%2F10.1186%5C%2Fs12942-020-00220-6%22%2C%22PMID%22%3A%22%22%2C%22PMCID%22%3A%22%22%2C%22ISSN%22%3A%221476-072X%22%2C%22language%22%3A%22en%22%2C%22collections%22%3A%5B%5D%2C%22dateModified%22%3A%222022-10-03T02%3A03%3A59Z%22%7D%7D%2C%7B%22key%22%3A%22B8ZGKWFH%22%2C%22library%22%3A%7B%22id%22%3A4800755%7D%2C%22meta%22%3A%7B%22creatorSummary%22%3A%22Herbreteau%22%2C%22parsedDate%22%3A%222020%22%2C%22numChildren%22%3A0%7D%2C%22bib%22%3A%22%26lt%3Bdiv%20class%3D%26quot%3Bcsl-bib-body%26quot%3B%20style%3D%26quot%3Bline-height%3A%202%3B%20padding-left%3A%201em%3B%20text-indent%3A-1em%3B%26quot%3B%26gt%3B%5Cn%20%20%26lt%3Bdiv%20class%3D%26quot%3Bcsl-entry%26quot%3B%26gt%3BHerbreteau%2C%20V.%20%282020%29.%20La%20leptospirose.%20In%20G.%20Salem%20%26amp%3B%20F.%20Fournet%20%28Eds.%29%2C%20%26lt%3Bi%26gt%3BAtlas%20mondial%20de%20la%20sant%26%23xE9%3B%26lt%3B%5C%2Fi%26gt%3B%20%28p.%2041%29.%20Autrement.%20%26lt%3Ba%20title%3D%26%23039%3BCite%20in%20RIS%20Format%26%23039%3B%20class%3D%26%23039%3Bzp-CiteRIS%26%23039%3B%20data-zp-cite%3D%26%23039%3Bapi_user_id%3D4800755%26amp%3Bitem_key%3DB8ZGKWFH%26%23039%3B%20href%3D%26%23039%3Bjavascript%3Avoid%280%29%3B%26%23039%3B%26gt%3BCite%26lt%3B%5C%2Fa%26gt%3B%20%26lt%3B%5C%2Fdiv%26gt%3B%5Cn%26lt%3B%5C%2Fdiv%26gt%3B%22%2C%22data%22%3A%7B%22itemType%22%3A%22bookSection%22%2C%22title%22%3A%22La%20leptospirose%22%2C%22creators%22%3A%5B%7B%22creatorType%22%3A%22editor%22%2C%22firstName%22%3A%22G%5Cu00e9rard%22%2C%22lastName%22%3A%22Salem%22%7D%2C%7B%22creatorType%22%3A%22editor%22%2C%22firstName%22%3A%22Florence%22%2C%22lastName%22%3A%22Fournet%22%7D%2C%7B%22creatorType%22%3A%22author%22%2C%22firstName%22%3A%22Vincent%22%2C%22lastName%22%3A%22Herbreteau%22%7D%5D%2C%22abstractNote%22%3A%22%22%2C%22bookTitle%22%3A%22Atlas%20mondial%20de%20la%20sant%5Cu00e9%22%2C%22date%22%3A%222020%22%2C%22originalDate%22%3A%22%22%2C%22originalPublisher%22%3A%22%22%2C%22originalPlace%22%3A%22%22%2C%22format%22%3A%22%22%2C%22ISBN%22%3A%222-7467-5564-5%22%2C%22DOI%22%3A%22%22%2C%22citationKey%22%3A%22%22%2C%22url%22%3A%22%22%2C%22ISSN%22%3A%22%22%2C%22language%22%3A%22%22%2C%22collections%22%3A%5B%5D%2C%22dateModified%22%3A%222022-10-03T02%3A03%3A59Z%22%7D%7D%2C%7B%22key%22%3A%224E7HG4KV%22%2C%22library%22%3A%7B%22id%22%3A4800755%7D%2C%22meta%22%3A%7B%22creatorSummary%22%3A%22R%5Cu00e9villion%20et%20al.%22%2C%22parsedDate%22%3A%222019-06-08%22%2C%22numChildren%22%3A0%7D%2C%22bib%22%3A%22%26lt%3Bdiv%20class%3D%26quot%3Bcsl-bib-body%26quot%3B%20style%3D%26quot%3Bline-height%3A%202%3B%20padding-left%3A%201em%3B%20text-indent%3A-1em%3B%26quot%3B%26gt%3B%5Cn%20%20%26lt%3Bdiv%20class%3D%26quot%3Bcsl-entry%26quot%3B%26gt%3BR%26%23xE9%3Bvillion%2C%20C.%2C%20Attoumane%2C%20A.%2C%20%26amp%3B%20Herbreteau%2C%20V.%20%282019%29.%20Homisland-IO%3A%20Homogeneous%20Land%20Use%5C%2FLand%20Cover%20over%20the%20Small%20Islands%20of%20the%20Indian%20Ocean.%20%26lt%3Bi%26gt%3BData%26lt%3B%5C%2Fi%26gt%3B%2C%20%26lt%3Bi%26gt%3B4%26lt%3B%5C%2Fi%26gt%3B%282%29%2C%2082.%20%26lt%3Ba%20class%3D%26%23039%3Bzp-DOIURL%26%23039%3B%20target%3D%26%23039%3B_blank%26%23039%3B%20href%3D%26%23039%3Bhttps%3A%5C%2F%5C%2Fdoi.org%5C%2F10.3390%5C%2Fdata4020082%26%23039%3B%26gt%3Bhttps%3A%5C%2F%5C%2Fdoi.org%5C%2F10.3390%5C%2Fdata4020082%26lt%3B%5C%2Fa%26gt%3B%20%26lt%3Ba%20title%3D%26%23039%3BCite%20in%20RIS%20Format%26%23039%3B%20class%3D%26%23039%3Bzp-CiteRIS%26%23039%3B%20data-zp-cite%3D%26%23039%3Bapi_user_id%3D4800755%26amp%3Bitem_key%3D4E7HG4KV%26%23039%3B%20href%3D%26%23039%3Bjavascript%3Avoid%280%29%3B%26%23039%3B%26gt%3BCite%26lt%3B%5C%2Fa%26gt%3B%20%26lt%3B%5C%2Fdiv%26gt%3B%5Cn%26lt%3B%5C%2Fdiv%26gt%3B%22%2C%22data%22%3A%7B%22itemType%22%3A%22journalArticle%22%2C%22title%22%3A%22Homisland-IO%3A%20Homogeneous%20Land%20Use%5C%2FLand%20Cover%20over%20the%20Small%20Islands%20of%20the%20Indian%20Ocean%22%2C%22creators%22%3A%5B%7B%22creatorType%22%3A%22author%22%2C%22firstName%22%3A%22Christophe%22%2C%22lastName%22%3A%22R%5Cu00e9villion%22%7D%2C%7B%22creatorType%22%3A%22author%22%2C%22firstName%22%3A%22Artadji%22%2C%22lastName%22%3A%22Attoumane%22%7D%2C%7B%22creatorType%22%3A%22author%22%2C%22firstName%22%3A%22Vincent%22%2C%22lastName%22%3A%22Herbreteau%22%7D%5D%2C%22abstractNote%22%3A%22%22%2C%22date%22%3A%222019-06-08%22%2C%22section%22%3A%22%22%2C%22partNumber%22%3A%22%22%2C%22partTitle%22%3A%22%22%2C%22DOI%22%3A%2210.3390%5C%2Fdata4020082%22%2C%22citationKey%22%3A%22%22%2C%22url%22%3A%22https%3A%5C%2F%5C%2Fwww.mdpi.com%5C%2F2306-5729%5C%2F4%5C%2F2%5C%2F82%22%2C%22PMID%22%3A%22%22%2C%22PMCID%22%3A%22%22%2C%22ISSN%22%3A%222306-5729%22%2C%22language%22%3A%22en%22%2C%22collections%22%3A%5B%5D%2C%22dateModified%22%3A%222022-10-03T02%3A03%3A59Z%22%7D%7D%2C%7B%22key%22%3A%226NSUYZRT%22%2C%22library%22%3A%7B%22id%22%3A4800755%7D%2C%22meta%22%3A%7B%22creatorSummary%22%3A%22Lebeau-Desmoulin%20et%20al.%22%2C%22parsedDate%22%3A%222019%22%2C%22numChildren%22%3A0%7D%2C%22bib%22%3A%22%26lt%3Bdiv%20class%3D%26quot%3Bcsl-bib-body%26quot%3B%20style%3D%26quot%3Bline-height%3A%202%3B%20padding-left%3A%201em%3B%20text-indent%3A-1em%3B%26quot%3B%26gt%3B%5Cn%20%20%26lt%3Bdiv%20class%3D%26quot%3Bcsl-entry%26quot%3B%26gt%3BLebeau-Desmoulin%2C%20L.%2C%20Bruneau%2C%20L.%2C%20Commins%2C%20J.%2C%20Herbreteau%2C%20V.%2C%20%26amp%3B%20Raffray%2C%20L.%20%282019%29.%20Identifying%20factors%20associated%20with%20treatment%20delay%20in%20leptospirosis%3A%20A%20retrospective%20study%20of%20patients%20admitted%20to%20hospital%20in%20Reunion%20%28Indian%20Ocean%29%20between%202014%20and%202015.%20%26lt%3Bi%26gt%3BM%26%23xE9%3Bdecine%20et%20Maladies%20Infectieuses%26lt%3B%5C%2Fi%26gt%3B.%20%26lt%3Ba%20class%3D%26%23039%3Bzp-DOIURL%26%23039%3B%20target%3D%26%23039%3B_blank%26%23039%3B%20href%3D%26%23039%3Bhttps%3A%5C%2F%5C%2Fdoi.org%5C%2F10.1016%5C%2Fj.medmal.2019.09.008%26%23039%3B%26gt%3Bhttps%3A%5C%2F%5C%2Fdoi.org%5C%2F10.1016%5C%2Fj.medmal.2019.09.008%26lt%3B%5C%2Fa%26gt%3B%20%26lt%3Ba%20title%3D%26%23039%3BCite%20in%20RIS%20Format%26%23039%3B%20class%3D%26%23039%3Bzp-CiteRIS%26%23039%3B%20data-zp-cite%3D%26%23039%3Bapi_user_id%3D4800755%26amp%3Bitem_key%3D6NSUYZRT%26%23039%3B%20href%3D%26%23039%3Bjavascript%3Avoid%280%29%3B%26%23039%3B%26gt%3BCite%26lt%3B%5C%2Fa%26gt%3B%20%26lt%3B%5C%2Fdiv%26gt%3B%5Cn%26lt%3B%5C%2Fdiv%26gt%3B%22%2C%22data%22%3A%7B%22itemType%22%3A%22journalArticle%22%2C%22title%22%3A%22Identifying%20factors%20associated%20with%20treatment%20delay%20in%20leptospirosis%3A%20A%20retrospective%20study%20of%20patients%20admitted%20to%20hospital%20in%20Reunion%20%28Indian%20Ocean%29%20between%202014%20and%202015%22%2C%22creators%22%3A%5B%7B%22creatorType%22%3A%22author%22%2C%22firstName%22%3A%22L.%22%2C%22lastName%22%3A%22Lebeau-Desmoulin%22%7D%2C%7B%22creatorType%22%3A%22author%22%2C%22firstName%22%3A%22L.%22%2C%22lastName%22%3A%22Bruneau%22%7D%2C%7B%22creatorType%22%3A%22author%22%2C%22firstName%22%3A%22J.%22%2C%22lastName%22%3A%22Commins%22%7D%2C%7B%22creatorType%22%3A%22author%22%2C%22firstName%22%3A%22V.%22%2C%22lastName%22%3A%22Herbreteau%22%7D%2C%7B%22creatorType%22%3A%22author%22%2C%22firstName%22%3A%22L.%22%2C%22lastName%22%3A%22Raffray%22%7D%5D%2C%22abstractNote%22%3A%22%22%2C%22date%22%3A%2210%5C%2F2019%22%2C%22section%22%3A%22%22%2C%22partNumber%22%3A%22%22%2C%22partTitle%22%3A%22%22%2C%22DOI%22%3A%2210.1016%5C%2Fj.medmal.2019.09.008%22%2C%22citationKey%22%3A%22%22%2C%22url%22%3A%22https%3A%5C%2F%5C%2Flinkinghub.elsevier.com%5C%2Fretrieve%5C%2Fpii%5C%2FS0399077X1830711X%22%2C%22PMID%22%3A%22%22%2C%22PMCID%22%3A%22%22%2C%22ISSN%22%3A%220399077X%22%2C%22language%22%3A%22en%22%2C%22collections%22%3A%5B%5D%2C%22dateModified%22%3A%222022-10-03T02%3A03%3A59Z%22%7D%7D%2C%7B%22key%22%3A%22W4VXBD35%22%2C%22library%22%3A%7B%22id%22%3A4800755%7D%2C%22meta%22%3A%7B%22creatorSummary%22%3A%22Ihantamalala%20et%20al.%22%2C%22parsedDate%22%3A%222018-09-25%22%2C%22numChildren%22%3A2%7D%2C%22bib%22%3A%22%26lt%3Bdiv%20class%3D%26quot%3Bcsl-bib-body%26quot%3B%20style%3D%26quot%3Bline-height%3A%202%3B%20padding-left%3A%201em%3B%20text-indent%3A-1em%3B%26quot%3B%26gt%3B%5Cn%20%20%26lt%3Bdiv%20class%3D%26quot%3Bcsl-entry%26quot%3B%26gt%3BIhantamalala%2C%20F.%20A.%2C%20Herbreteau%2C%20V.%2C%20Rakotoarimanana%2C%20F.%20M.%20J.%2C%20Rakotondramanga%2C%20J.%20M.%2C%20Cauchemez%2C%20S.%2C%20Rahoilijaona%2C%20B.%2C%20Pennober%2C%20G.%2C%20Buckee%2C%20C.%20O.%2C%20Rogier%2C%20C.%2C%20Metcalf%2C%20C.%20J.%20E.%2C%20%26amp%3B%20Wesolowski%2C%20A.%20%282018%29.%20Estimating%20sources%20and%20sinks%20of%20malaria%20parasites%20in%20Madagascar.%20%26lt%3Bi%26gt%3BNat%20Commun%26lt%3B%5C%2Fi%26gt%3B%2C%20%26lt%3Bi%26gt%3B9%26lt%3B%5C%2Fi%26gt%3B%281%29%2C%203897.%20%26lt%3Ba%20class%3D%26%23039%3Bzp-DOIURL%26%23039%3B%20target%3D%26%23039%3B_blank%26%23039%3B%20href%3D%26%23039%3Bhttps%3A%5C%2F%5C%2Fdoi.org%5C%2F10.1038%5C%2Fs41467-018-06290-2%26%23039%3B%26gt%3Bhttps%3A%5C%2F%5C%2Fdoi.org%5C%2F10.1038%5C%2Fs41467-018-06290-2%26lt%3B%5C%2Fa%26gt%3B%20%26lt%3Ba%20title%3D%26%23039%3BCite%20in%20RIS%20Format%26%23039%3B%20class%3D%26%23039%3Bzp-CiteRIS%26%23039%3B%20data-zp-cite%3D%26%23039%3Bapi_user_id%3D4800755%26amp%3Bitem_key%3DW4VXBD35%26%23039%3B%20href%3D%26%23039%3Bjavascript%3Avoid%280%29%3B%26%23039%3B%26gt%3BCite%26lt%3B%5C%2Fa%26gt%3B%20%26lt%3B%5C%2Fdiv%26gt%3B%5Cn%26lt%3B%5C%2Fdiv%26gt%3B%22%2C%22data%22%3A%7B%22itemType%22%3A%22journalArticle%22%2C%22title%22%3A%22Estimating%20sources%20and%20sinks%20of%20malaria%20parasites%20in%20Madagascar%22%2C%22creators%22%3A%5B%7B%22creatorType%22%3A%22author%22%2C%22firstName%22%3A%22F.%20A.%22%2C%22lastName%22%3A%22Ihantamalala%22%7D%2C%7B%22creatorType%22%3A%22author%22%2C%22firstName%22%3A%22V.%22%2C%22lastName%22%3A%22Herbreteau%22%7D%2C%7B%22creatorType%22%3A%22author%22%2C%22firstName%22%3A%22F.%20M.%20J.%22%2C%22lastName%22%3A%22Rakotoarimanana%22%7D%2C%7B%22creatorType%22%3A%22author%22%2C%22firstName%22%3A%22J.%20M.%22%2C%22lastName%22%3A%22Rakotondramanga%22%7D%2C%7B%22creatorType%22%3A%22author%22%2C%22firstName%22%3A%22S.%22%2C%22lastName%22%3A%22Cauchemez%22%7D%2C%7B%22creatorType%22%3A%22author%22%2C%22firstName%22%3A%22B.%22%2C%22lastName%22%3A%22Rahoilijaona%22%7D%2C%7B%22creatorType%22%3A%22author%22%2C%22firstName%22%3A%22G.%22%2C%22lastName%22%3A%22Pennober%22%7D%2C%7B%22creatorType%22%3A%22author%22%2C%22firstName%22%3A%22C.%20O.%22%2C%22lastName%22%3A%22Buckee%22%7D%2C%7B%22creatorType%22%3A%22author%22%2C%22firstName%22%3A%22C.%22%2C%22lastName%22%3A%22Rogier%22%7D%2C%7B%22creatorType%22%3A%22author%22%2C%22firstName%22%3A%22C.%20J.%20E.%22%2C%22lastName%22%3A%22Metcalf%22%7D%2C%7B%22creatorType%22%3A%22author%22%2C%22firstName%22%3A%22A.%22%2C%22lastName%22%3A%22Wesolowski%22%7D%5D%2C%22abstractNote%22%3A%22In%20areas%20where%20malaria%20epidemiology%20is%20spatially%20and%20temporally%20heterogeneous%2C%20human-mediated%20parasite%20importation%20can%20result%20in%20non-locally%20acquired%20clinical%20cases%20and%20outbreaks%20in%20low-transmission%20areas.%20Using%20mobility%20estimates%20derived%20from%20the%20mobile%20phone%20data%20and%20spatial%20malaria%20prevalence%20data%2C%20we%20identify%20travel%20routes%20relevant%20to%20malaria%20transmission%20in%20Madagascar.%20We%20find%20that%20the%20primary%20hubs%20of%20parasite%20importation%20are%20in%20a%20spatially%20connected%20area%20of%20the%20central%20highlands.%20Surprisingly%2C%20sources%20of%20these%20imported%20infections%20are%20not%20spatially%20clustered.%20We%20then%20related%20these%20source%20locations%20directly%20to%20clinical%20cases%20in%20the%20low-transmission%20area%20of%20the%20capital.%20We%20find%20that%20in%20the%20capital%2C%20a%20major%20sink%2C%20the%20primary%20sources%20of%20infection%20are%20along%20the%20more%20populated%20coastal%20areas%2C%20although%20these%20sources%20are%20seasonally%20variable.%20Our%20results%20have%20implications%20for%20targeting%20interventions%20at%20source%20locations%20to%20achieve%20local%20or%20national%20malaria%20control%20goals.%22%2C%22date%22%3A%222018%20Sep%2025%22%2C%22section%22%3A%22%22%2C%22partNumber%22%3A%22%22%2C%22partTitle%22%3A%22%22%2C%22DOI%22%3A%2210.1038%5C%2Fs41467-018-06290-2%22%2C%22citationKey%22%3A%22%22%2C%22url%22%3A%22http%3A%5C%2F%5C%2Fwww.ncbi.nlm.nih.gov%5C%2Fpubmed%5C%2F30254280%20https%3A%5C%2F%5C%2Fwww.nature.com%5C%2Farticles%5C%2Fs41467-018-06290-2.pdf%22%2C%22PMID%22%3A%22%22%2C%22PMCID%22%3A%22%22%2C%22ISSN%22%3A%222041-1723%20%28Electronic%29%202041-1723%20%28Linking%29%22%2C%22language%22%3A%22%22%2C%22collections%22%3A%5B%5D%2C%22dateModified%22%3A%222022-10-03T02%3A03%3A59Z%22%7D%7D%2C%7B%22key%22%3A%22PSZ7T6GR%22%2C%22library%22%3A%7B%22id%22%3A4800755%7D%2C%22meta%22%3A%7B%22creatorSummary%22%3A%22Girond%20et%20al.%22%2C%22parsedDate%22%3A%222018-07%22%2C%22numChildren%22%3A1%7D%2C%22bib%22%3A%22%26lt%3Bdiv%20class%3D%26quot%3Bcsl-bib-body%26quot%3B%20style%3D%26quot%3Bline-height%3A%202%3B%20padding-left%3A%201em%3B%20text-indent%3A-1em%3B%26quot%3B%26gt%3B%5Cn%20%20%26lt%3Bdiv%20class%3D%26quot%3Bcsl-entry%26quot%3B%26gt%3BGirond%2C%20F.%2C%20Madec%2C%20Y.%2C%20Kesteman%2C%20T.%2C%20Randrianarivelojosia%2C%20M.%2C%20Randremanana%2C%20R.%2C%20Randriamampionona%2C%20L.%2C%20Randrianasolo%2C%20L.%2C%20Ratsitorahina%2C%20M.%2C%20Herbreteau%2C%20V.%2C%20Hedje%2C%20J.%2C%20Rogier%2C%20C.%2C%20%26amp%3B%20Piola%2C%20P.%20%282018%29.%20Evaluating%20Effectiveness%20of%20Mass%20and%20Continuous%20Long-lasting%20Insecticidal%20Net%20Distributions%20Over%20Time%20in%20Madagascar%3A%20A%20Sentinel%20Surveillance%20Based%20Epidemiological%20Study.%20%26lt%3Bi%26gt%3BEClinicalMedicine%26lt%3B%5C%2Fi%26gt%3B%2C%20%26lt%3Bi%26gt%3B1%26lt%3B%5C%2Fi%26gt%3B%2C%2062%26%23x2013%3B69.%20%26lt%3Ba%20class%3D%26%23039%3Bzp-DOIURL%26%23039%3B%20target%3D%26%23039%3B_blank%26%23039%3B%20href%3D%26%23039%3Bhttps%3A%5C%2F%5C%2Fdoi.org%5C%2F10.1016%5C%2Fj.eclinm.2018.07.003%26%23039%3B%26gt%3Bhttps%3A%5C%2F%5C%2Fdoi.org%5C%2F10.1016%5C%2Fj.eclinm.2018.07.003%26lt%3B%5C%2Fa%26gt%3B%20%26lt%3Ba%20title%3D%26%23039%3BCite%20in%20RIS%20Format%26%23039%3B%20class%3D%26%23039%3Bzp-CiteRIS%26%23039%3B%20data-zp-cite%3D%26%23039%3Bapi_user_id%3D4800755%26amp%3Bitem_key%3DPSZ7T6GR%26%23039%3B%20href%3D%26%23039%3Bjavascript%3Avoid%280%29%3B%26%23039%3B%26gt%3BCite%26lt%3B%5C%2Fa%26gt%3B%20%26lt%3B%5C%2Fdiv%26gt%3B%5Cn%26lt%3B%5C%2Fdiv%26gt%3B%22%2C%22data%22%3A%7B%22itemType%22%3A%22journalArticle%22%2C%22title%22%3A%22Evaluating%20Effectiveness%20of%20Mass%20and%20Continuous%20Long-lasting%20Insecticidal%20Net%20Distributions%20Over%20Time%20in%20Madagascar%3A%20A%20Sentinel%20Surveillance%20Based%20Epidemiological%20Study%22%2C%22creators%22%3A%5B%7B%22creatorType%22%3A%22author%22%2C%22firstName%22%3A%22F.%22%2C%22lastName%22%3A%22Girond%22%7D%2C%7B%22creatorType%22%3A%22author%22%2C%22firstName%22%3A%22Y.%22%2C%22lastName%22%3A%22Madec%22%7D%2C%7B%22creatorType%22%3A%22author%22%2C%22firstName%22%3A%22T.%22%2C%22lastName%22%3A%22Kesteman%22%7D%2C%7B%22creatorType%22%3A%22author%22%2C%22firstName%22%3A%22M.%22%2C%22lastName%22%3A%22Randrianarivelojosia%22%7D%2C%7B%22creatorType%22%3A%22author%22%2C%22firstName%22%3A%22R.%22%2C%22lastName%22%3A%22Randremanana%22%7D%2C%7B%22creatorType%22%3A%22author%22%2C%22firstName%22%3A%22L.%22%2C%22lastName%22%3A%22Randriamampionona%22%7D%2C%7B%22creatorType%22%3A%22author%22%2C%22firstName%22%3A%22L.%22%2C%22lastName%22%3A%22Randrianasolo%22%7D%2C%7B%22creatorType%22%3A%22author%22%2C%22firstName%22%3A%22M.%22%2C%22lastName%22%3A%22Ratsitorahina%22%7D%2C%7B%22creatorType%22%3A%22author%22%2C%22firstName%22%3A%22V.%22%2C%22lastName%22%3A%22Herbreteau%22%7D%2C%7B%22creatorType%22%3A%22author%22%2C%22firstName%22%3A%22J.%22%2C%22lastName%22%3A%22Hedje%22%7D%2C%7B%22creatorType%22%3A%22author%22%2C%22firstName%22%3A%22C.%22%2C%22lastName%22%3A%22Rogier%22%7D%2C%7B%22creatorType%22%3A%22author%22%2C%22firstName%22%3A%22P.%22%2C%22lastName%22%3A%22Piola%22%7D%5D%2C%22abstractNote%22%3A%22Background%3A%20The%20reduction%20of%20global%20malaria%20burden%20over%20the%20past%2015%20years%20is%20much%20attributed%20to%20the%20expansion%20of%20mass%20distribution%20campaigns%20%28MDCs%29%20of%20long-lasting%20insecticidal%20nets%20%28LLIN%29.%20In%20Madagascar%2C%20two%20LUN%20MDCs%20were%20implemented%20and%20one%20district%20also%20benefited%20from%20a%20community-based%20continuous%20distribution%20%28CB-CD%29.%20Malaria%20incidence%20dropped%20but%20eventually%20rebounded%20after%20a%20decade.%20Methods%3A%20Data%20from%20a%20sentinel%20surveillance%20network%20over%20the%202009-2015%20period%20was%20analyzed.%20Alerts%20were%20defined%20as%20w%20eekly%20number%20o%20f%20malaria%20cases%20exceeding%20the%2090th%20percentile%20value%20for%20three%20consecutive%20weeks.%20Statistical%20analyses%20assessed%20the%20temporal%20relationship%20between%20LLIN%20MDCs%20and%20%28i%29%20number%20of%20malaria%20cases%20and%20%28ii%29%20malaria%20alerts%20detected%2C%20and%20%28iii%29%20the%20effect%20of%20a%20combination%20of%20MDCs%20and%20a%20CB-CD%20in%20Toamasina%20District.%20Findings%3A%20Analyses%20showed%20an%20increase%20of%2013.6%20points%20and%2021.4%20points%20in%20the%20percentile%20value%20of%20weekly%20malaria%20cases%20during%20the%20second%20and%20the%20third%20year%20following%20the%20MDC%20of%20LLINs%20respectively.%20The%20percentage%20of%20alert-free%20sentinel%20sites%20was%2098.2%25%20during%20the%20first%20year%20after%20LLIN%20MDC%2C%2056.7%25%20during%20the%20second%20year%20and%2031.5%25%20during%20the%20third%20year.%20The%20number%20of%20weekly%20malaria%20cases%20decreased%20by%2014%25%20during%20the%20CB-CD%20in%20Toamasina%20District.%20In%20contrast%2C%20sites%20without%20continuous%20distribution%20had%20a%2012%25%20increase%20of%20malaria%20cases.%20Interpretation%3A%20These%20findings%20support%20the%20malaria-preventive%20effectiveness%20of%20MDCs%20in%20Madagascar%20but%20highlight%20their%20limited%20duration%20when%20not%20followed%20by%20continuous%20distribution.%20The%20resulting%20policy%20implications%20are%20crucial%20to%20sustain%20reductions%20in%20malaria%20burden%20in%20high%20transmission%20settings.%22%2C%22date%22%3A%222018%20Jul%22%2C%22section%22%3A%22%22%2C%22partNumber%22%3A%22%22%2C%22partTitle%22%3A%22%22%2C%22DOI%22%3A%2210.1016%5C%2Fj.eclinm.2018.07.003%22%2C%22citationKey%22%3A%22%22%2C%22url%22%3A%22http%3A%5C%2F%5C%2Fwww.ncbi.nlm.nih.gov%5C%2Fpubmed%5C%2F30294720%22%2C%22PMID%22%3A%22%22%2C%22PMCID%22%3A%22%22%2C%22ISSN%22%3A%222589-5370%20%28Electronic%29%22%2C%22language%22%3A%22%22%2C%22collections%22%3A%5B%5D%2C%22dateModified%22%3A%222022-10-03T02%3A03%3A59Z%22%7D%7D%2C%7B%22key%22%3A%224PRUF987%22%2C%22library%22%3A%7B%22id%22%3A4800755%7D%2C%22meta%22%3A%7B%22creatorSummary%22%3A%22Ouedraogo%20et%20al.%22%2C%22parsedDate%22%3A%222018-04-02%22%2C%22numChildren%22%3A1%7D%2C%22bib%22%3A%22%26lt%3Bdiv%20class%3D%26quot%3Bcsl-bib-body%26quot%3B%20style%3D%26quot%3Bline-height%3A%202%3B%20padding-left%3A%201em%3B%20text-indent%3A-1em%3B%26quot%3B%26gt%3B%5Cn%20%20%26lt%3Bdiv%20class%3D%26quot%3Bcsl-entry%26quot%3B%26gt%3BOuedraogo%2C%20B.%2C%20Inoue%2C%20Y.%2C%20Kambire%2C%20A.%2C%20Sallah%2C%20K.%2C%20Dieng%2C%20S.%2C%20Tine%2C%20R.%2C%20Rouamba%2C%20T.%2C%20Herbreteau%2C%20V.%2C%20Sawadogo%2C%20Y.%2C%20Ouedraogo%2C%20L.%2C%20Yaka%2C%20P.%2C%20Ouedraogo%2C%20E.%20K.%2C%20Dufour%2C%20J.%20C.%2C%20%26amp%3B%20Gaudart%2C%20J.%20%282018%29.%20Spatio-temporal%20dynamic%20of%20malaria%20in%20Ouagadougou%2C%20Burkina%20Faso%2C%202011-2015.%20%26lt%3Bi%26gt%3BMalar%20J%26lt%3B%5C%2Fi%26gt%3B%2C%20%26lt%3Bi%26gt%3B17%26lt%3B%5C%2Fi%26gt%3B%281%29%2C%20138.%20%26lt%3Ba%20class%3D%26%23039%3Bzp-DOIURL%26%23039%3B%20target%3D%26%23039%3B_blank%26%23039%3B%20href%3D%26%23039%3Bhttps%3A%5C%2F%5C%2Fdoi.org%5C%2F10.1186%5C%2Fs12936-018-2280-y%26%23039%3B%26gt%3Bhttps%3A%5C%2F%5C%2Fdoi.org%5C%2F10.1186%5C%2Fs12936-018-2280-y%26lt%3B%5C%2Fa%26gt%3B%20%26lt%3Ba%20title%3D%26%23039%3BCite%20in%20RIS%20Format%26%23039%3B%20class%3D%26%23039%3Bzp-CiteRIS%26%23039%3B%20data-zp-cite%3D%26%23039%3Bapi_user_id%3D4800755%26amp%3Bitem_key%3D4PRUF987%26%23039%3B%20href%3D%26%23039%3Bjavascript%3Avoid%280%29%3B%26%23039%3B%26gt%3BCite%26lt%3B%5C%2Fa%26gt%3B%20%26lt%3B%5C%2Fdiv%26gt%3B%5Cn%26lt%3B%5C%2Fdiv%26gt%3B%22%2C%22data%22%3A%7B%22itemType%22%3A%22journalArticle%22%2C%22title%22%3A%22Spatio-temporal%20dynamic%20of%20malaria%20in%20Ouagadougou%2C%20Burkina%20Faso%2C%202011-2015%22%2C%22creators%22%3A%5B%7B%22creatorType%22%3A%22author%22%2C%22firstName%22%3A%22B.%22%2C%22lastName%22%3A%22Ouedraogo%22%7D%2C%7B%22creatorType%22%3A%22author%22%2C%22firstName%22%3A%22Y.%22%2C%22lastName%22%3A%22Inoue%22%7D%2C%7B%22creatorType%22%3A%22author%22%2C%22firstName%22%3A%22A.%22%2C%22lastName%22%3A%22Kambire%22%7D%2C%7B%22creatorType%22%3A%22author%22%2C%22firstName%22%3A%22K.%22%2C%22lastName%22%3A%22Sallah%22%7D%2C%7B%22creatorType%22%3A%22author%22%2C%22firstName%22%3A%22S.%22%2C%22lastName%22%3A%22Dieng%22%7D%2C%7B%22creatorType%22%3A%22author%22%2C%22firstName%22%3A%22R.%22%2C%22lastName%22%3A%22Tine%22%7D%2C%7B%22creatorType%22%3A%22author%22%2C%22firstName%22%3A%22T.%22%2C%22lastName%22%3A%22Rouamba%22%7D%2C%7B%22creatorType%22%3A%22author%22%2C%22firstName%22%3A%22V.%22%2C%22lastName%22%3A%22Herbreteau%22%7D%2C%7B%22creatorType%22%3A%22author%22%2C%22firstName%22%3A%22Y.%22%2C%22lastName%22%3A%22Sawadogo%22%7D%2C%7B%22creatorType%22%3A%22author%22%2C%22firstName%22%3A%22Lslw%22%2C%22lastName%22%3A%22Ouedraogo%22%7D%2C%7B%22creatorType%22%3A%22author%22%2C%22firstName%22%3A%22P.%22%2C%22lastName%22%3A%22Yaka%22%7D%2C%7B%22creatorType%22%3A%22author%22%2C%22firstName%22%3A%22E.%20K.%22%2C%22lastName%22%3A%22Ouedraogo%22%7D%2C%7B%22creatorType%22%3A%22author%22%2C%22firstName%22%3A%22J.%20C.%22%2C%22lastName%22%3A%22Dufour%22%7D%2C%7B%22creatorType%22%3A%22author%22%2C%22firstName%22%3A%22J.%22%2C%22lastName%22%3A%22Gaudart%22%7D%5D%2C%22abstractNote%22%3A%22BACKGROUND%3A%20Given%20the%20scarcity%20of%20resources%20in%20developing%20countries%2C%20malaria%20treatment%20requires%20new%20strategies%20that%20target%20specific%20populations%2C%20time%20periods%20and%20geographical%20areas.%20While%20the%20spatial%20pattern%20of%20malaria%20transmission%20is%20known%20to%20vary%20depending%20on%20local%20conditions%2C%20its%20temporal%20evolution%20has%20yet%20to%20be%20evaluated.%20The%20aim%20of%20this%20study%20was%20to%20determine%20the%20spatio-temporal%20dynamic%20of%20malaria%20in%20the%20central%20region%20of%20Burkina%20Faso%2C%20taking%20into%20account%20meteorological%20factors.%20METHODS%3A%20Drawing%20on%20national%20databases%2C%20101%20health%20areas%20were%20studied%20from%202011%20to%202015%2C%20together%20with%20weekly%20meteorological%20data%20%28temperature%2C%20number%20of%20rain%20events%2C%20rainfall%2C%20humidity%2C%20wind%20speed%29.%20Meteorological%20factors%20were%20investigated%20using%20a%20principal%20component%20analysis%20%28PCA%29%20to%20reduce%20dimensions%20and%20avoid%20collinearities.%20The%20Box-Jenkins%20ARIMA%20model%20was%20used%20to%20test%20the%20stationarity%20of%20the%20time%20series.%20The%20impact%20of%20meteorological%20factors%20on%20malaria%20incidence%20was%20measured%20with%20a%20general%20additive%20model.%20A%20change-point%20analysis%20was%20performed%20to%20detect%20malaria%20transmission%20periods.%20For%20each%20transmission%20period%2C%20malaria%20incidence%20was%20mapped%20and%20hotspots%20were%20identified%20using%20spatial%20cluster%20detection.%20RESULTS%3A%20Malaria%20incidence%20never%20went%20below%2013.7%20cases%5C%2F10%2C000%20person-weeks.%20The%20first%20and%20second%20PCA%20components%20%28constituted%20by%20rain%5C%2Fhumidity%20and%20temperatures%2C%20respectively%29%20were%20correlated%20with%20malaria%20incidence%20with%20a%20lag%20of%202%20weeks.%20The%20impact%20of%20temperature%20was%20significantly%20non-linear%3A%20malaria%20incidence%20increased%20with%20temperature%20but%20declined%20sharply%20with%20high%20temperature.%20A%20significant%20positive%20linear%20trend%20was%20found%20for%20the%20entire%20time%20period.%20Three%20transmission%20periods%20were%20detected%3A%20low%20%2816.8-29.9%20cases%5C%2F10%2C000%20person-weeks%29%2C%20high%20%2851.7-84.8%20cases%5C%2F10%2C000%20person-weeks%29%2C%20and%20intermediate%20%2826.7-32.2%20cases%5C%2F10%2C000%20person-weeks%29.%20The%20location%20of%20clusters%20identified%20as%20high%20risk%20varied%20little%20across%20transmission%20periods.%20CONCLUSION%3A%20This%20study%20highlighted%20the%20spatial%20variability%20and%20relative%20temporal%20stability%20of%20malaria%20incidence%20around%20the%20capital%20Ouagadougou%2C%20in%20the%20central%20region%20of%20Burkina%20Faso.%20Despite%20increasing%20efforts%20in%20fighting%20the%20disease%2C%20malaria%20incidence%20remained%20high%20and%20increased%20over%20the%20period%20of%20study.%20Hotspots%2C%20particularly%20those%20detected%20for%20low%20transmission%20periods%2C%20should%20be%20investigated%20further%20to%20uncover%20the%20local%20environmental%20and%20behavioural%20factors%20of%20transmission%2C%20and%20hence%20to%20allow%20for%20the%20development%20of%20better%20targeted%20control%20strategies.%22%2C%22date%22%3A%222018%20Apr%202%22%2C%22section%22%3A%22%22%2C%22partNumber%22%3A%22%22%2C%22partTitle%22%3A%22%22%2C%22DOI%22%3A%2210.1186%5C%2Fs12936-018-2280-y%22%2C%22citationKey%22%3A%22%22%2C%22url%22%3A%22http%3A%5C%2F%5C%2Fwww.ncbi.nlm.nih.gov%5C%2Fpubmed%5C%2F29609606%20https%3A%5C%2F%5C%2Fmalariajournal.biomedcentral.com%5C%2Ftrack%5C%2Fpdf%5C%2F10.1186%5C%2Fs12936-018-2280-y%22%2C%22PMID%22%3A%22%22%2C%22PMCID%22%3A%22%22%2C%22ISSN%22%3A%221475-2875%20%28Electronic%29%201475-2875%20%28Linking%29%22%2C%22language%22%3A%22%22%2C%22collections%22%3A%5B%5D%2C%22dateModified%22%3A%222022-10-03T02%3A03%3A59Z%22%7D%7D%2C%7B%22key%22%3A%22C7T4XFGJ%22%2C%22library%22%3A%7B%22id%22%3A4800755%7D%2C%22meta%22%3A%7B%22creatorSummary%22%3A%22Ihantamalala%20et%20al.%22%2C%22parsedDate%22%3A%222018-02%22%2C%22numChildren%22%3A0%7D%2C%22bib%22%3A%22%26lt%3Bdiv%20class%3D%26quot%3Bcsl-bib-body%26quot%3B%20style%3D%26quot%3Bline-height%3A%202%3B%20padding-left%3A%201em%3B%20text-indent%3A-1em%3B%26quot%3B%26gt%3B%5Cn%20%20%26lt%3Bdiv%20class%3D%26quot%3Bcsl-entry%26quot%3B%26gt%3BIhantamalala%2C%20F.%20A.%2C%20Rakotoarimanana%2C%20F.%20M.%20J.%2C%20Ramiadantsoa%2C%20T.%2C%20Rakotondramanga%2C%20J.%20M.%2C%20Pennober%2C%20G.%2C%20Rakotomanana%2C%20F.%2C%20Cauchemez%2C%20S.%2C%20Metcalf%2C%20C.%20J.%20E.%2C%20Herbreteau%2C%20V.%2C%20%26amp%3B%20Wesolowski%2C%20A.%20%282018%29.%20Spatial%20and%20temporal%20dynamics%20of%20malaria%20in%20Madagascar.%20%26lt%3Bi%26gt%3BMalaria%20Journal%26lt%3B%5C%2Fi%26gt%3B%2C%20%26lt%3Bi%26gt%3B17%26lt%3B%5C%2Fi%26gt%3B%281%29%2C%2058.%20%26lt%3Ba%20class%3D%26%23039%3Bzp-ItemURL%26%23039%3B%20target%3D%26%23039%3B_blank%26%23039%3B%20href%3D%26%23039%3Bhttps%3A%5C%2F%5C%2Fdoi.org%5C%2F10.1186%5C%2Fs12936-018-2206-8%26%23039%3B%26gt%3Bhttps%3A%5C%2F%5C%2Fdoi.org%5C%2F10.1186%5C%2Fs12936-018-2206-8%26lt%3B%5C%2Fa%26gt%3B%20%26lt%3Ba%20title%3D%26%23039%3BCite%20in%20RIS%20Format%26%23039%3B%20class%3D%26%23039%3Bzp-CiteRIS%26%23039%3B%20data-zp-cite%3D%26%23039%3Bapi_user_id%3D4800755%26amp%3Bitem_key%3DC7T4XFGJ%26%23039%3B%20href%3D%26%23039%3Bjavascript%3Avoid%280%29%3B%26%23039%3B%26gt%3BCite%26lt%3B%5C%2Fa%26gt%3B%20%26lt%3B%5C%2Fdiv%26gt%3B%5Cn%26lt%3B%5C%2Fdiv%26gt%3B%22%2C%22data%22%3A%7B%22itemType%22%3A%22journalArticle%22%2C%22title%22%3A%22Spatial%20and%20temporal%20dynamics%20of%20malaria%20in%20Madagascar%22%2C%22creators%22%3A%5B%7B%22creatorType%22%3A%22author%22%2C%22firstName%22%3A%22Felana%20A.%22%2C%22lastName%22%3A%22Ihantamalala%22%7D%2C%7B%22creatorType%22%3A%22author%22%2C%22firstName%22%3A%22Feno%20M.%20J.%22%2C%22lastName%22%3A%22Rakotoarimanana%22%7D%2C%7B%22creatorType%22%3A%22author%22%2C%22firstName%22%3A%22Tanjona%22%2C%22lastName%22%3A%22Ramiadantsoa%22%7D%2C%7B%22creatorType%22%3A%22author%22%2C%22firstName%22%3A%22Jean%20Marius%22%2C%22lastName%22%3A%22Rakotondramanga%22%7D%2C%7B%22creatorType%22%3A%22author%22%2C%22firstName%22%3A%22Gwena%5Cu00eblle%22%2C%22lastName%22%3A%22Pennober%22%7D%2C%7B%22creatorType%22%3A%22author%22%2C%22firstName%22%3A%22Fanjasoa%22%2C%22lastName%22%3A%22Rakotomanana%22%7D%2C%7B%22creatorType%22%3A%22author%22%2C%22firstName%22%3A%22Simon%22%2C%22lastName%22%3A%22Cauchemez%22%7D%2C%7B%22creatorType%22%3A%22author%22%2C%22firstName%22%3A%22Charlotte%20J.%20E.%22%2C%22lastName%22%3A%22Metcalf%22%7D%2C%7B%22creatorType%22%3A%22author%22%2C%22firstName%22%3A%22Vincent%22%2C%22lastName%22%3A%22Herbreteau%22%7D%2C%7B%22creatorType%22%3A%22author%22%2C%22firstName%22%3A%22Amy%22%2C%22lastName%22%3A%22Wesolowski%22%7D%5D%2C%22abstractNote%22%3A%22Malaria%20is%20one%20of%20the%20primary%20health%20concerns%20in%20Madagascar.%20Based%20on%20the%20duration%20and%20intensity%20of%20transmission%2C%20Madagascar%20is%20divided%20into%20five%20epidemiological%20strata%20that%20range%20from%20low%20to%20mesoendemic%20transmission.%20In%20this%20study%2C%20the%20spatial%20and%20temporal%20dynamics%20of%20malaria%20within%20each%20epidemiological%20zone%5Cu00a0were%20studied.%22%2C%22date%22%3A%222018%20February%22%2C%22section%22%3A%22%22%2C%22partNumber%22%3A%22%22%2C%22partTitle%22%3A%22%22%2C%22DOI%22%3A%2210.1186%5C%2Fs12936-018-2206-8%22%2C%22citationKey%22%3A%22%22%2C%22url%22%3A%22https%3A%5C%2F%5C%2Fdoi.org%5C%2F10.1186%5C%2Fs12936-018-2206-8%22%2C%22PMID%22%3A%22%22%2C%22PMCID%22%3A%22%22%2C%22ISSN%22%3A%221475-2875%22%2C%22language%22%3A%22%22%2C%22collections%22%3A%5B%5D%2C%22dateModified%22%3A%222022-10-03T02%3A03%3A59Z%22%7D%7D%2C%7B%22key%22%3A%22G8BECUJJ%22%2C%22library%22%3A%7B%22id%22%3A4800755%7D%2C%22meta%22%3A%7B%22creatorSummary%22%3A%22Herbreteau%20et%20al.%22%2C%22parsedDate%22%3A%222018-01-19%22%2C%22numChildren%22%3A0%7D%2C%22bib%22%3A%22%26lt%3Bdiv%20class%3D%26quot%3Bcsl-bib-body%26quot%3B%20style%3D%26quot%3Bline-height%3A%202%3B%20padding-left%3A%201em%3B%20text-indent%3A-1em%3B%26quot%3B%26gt%3B%5Cn%20%20%26lt%3Bdiv%20class%3D%26quot%3Bcsl-entry%26quot%3B%26gt%3BHerbreteau%2C%20V.%2C%20R%26%23xE9%3Bvillion%2C%20C.%2C%20%26amp%3B%20Trimaille%2C%20E.%20%282018%29.%20GeoHealth%20and%20QuickOSM%2C%20Two%20QGIS%20Plugins%20for%20Health%20Applications.%20In%20N.%20Baghdadi%2C%20C.%20Mallet%2C%20%26amp%3B%20M.%20Zribi%20%28Eds.%29%2C%20%26lt%3Bi%26gt%3BQGIS%20and%20Generic%20Tools%26lt%3B%5C%2Fi%26gt%3B%20%28pp.%20257%26%23x2013%3B286%29.%20John%20Wiley%20%26amp%3B%20Sons%2C%20Inc.%20https%3A%5C%2F%5C%2Fdoi.org%5C%2F10.1002%5C%2F9781119457091.ch7%20%26lt%3Ba%20title%3D%26%23039%3BCite%20in%20RIS%20Format%26%23039%3B%20class%3D%26%23039%3Bzp-CiteRIS%26%23039%3B%20data-zp-cite%3D%26%23039%3Bapi_user_id%3D4800755%26amp%3Bitem_key%3DG8BECUJJ%26%23039%3B%20href%3D%26%23039%3Bjavascript%3Avoid%280%29%3B%26%23039%3B%26gt%3BCite%26lt%3B%5C%2Fa%26gt%3B%20%26lt%3B%5C%2Fdiv%26gt%3B%5Cn%26lt%3B%5C%2Fdiv%26gt%3B%22%2C%22data%22%3A%7B%22itemType%22%3A%22bookSection%22%2C%22title%22%3A%22GeoHealth%20and%20QuickOSM%2C%20Two%20QGIS%20Plugins%20for%20Health%20Applications%22%2C%22creators%22%3A%5B%7B%22creatorType%22%3A%22editor%22%2C%22firstName%22%3A%22Nicolas%22%2C%22lastName%22%3A%22Baghdadi%22%7D%2C%7B%22creatorType%22%3A%22editor%22%2C%22firstName%22%3A%22Cl%5Cu00e9ment%22%2C%22lastName%22%3A%22Mallet%22%7D%2C%7B%22creatorType%22%3A%22editor%22%2C%22firstName%22%3A%22Mehrez%22%2C%22lastName%22%3A%22Zribi%22%7D%2C%7B%22creatorType%22%3A%22author%22%2C%22firstName%22%3A%22Vincent%22%2C%22lastName%22%3A%22Herbreteau%22%7D%2C%7B%22creatorType%22%3A%22author%22%2C%22firstName%22%3A%22Christophe%22%2C%22lastName%22%3A%22R%5Cu00e9villion%22%7D%2C%7B%22creatorType%22%3A%22author%22%2C%22firstName%22%3A%22Etienne%22%2C%22lastName%22%3A%22Trimaille%22%7D%5D%2C%22abstractNote%22%3A%22%22%2C%22bookTitle%22%3A%22QGIS%20and%20Generic%20Tools%22%2C%22date%22%3A%222018-01-19%22%2C%22originalDate%22%3A%22%22%2C%22originalPublisher%22%3A%22%22%2C%22originalPlace%22%3A%22%22%2C%22format%22%3A%22%22%2C%22ISBN%22%3A%22978-1-119-45709-1%20978-1-78630-187-1%22%2C%22DOI%22%3A%22%22%2C%22citationKey%22%3A%22%22%2C%22url%22%3A%22https%3A%5C%2F%5C%2Fonlinelibrary.wiley.com%5C%2Fdoi%5C%2F10.1002%5C%2F9781119457091.ch7%22%2C%22ISSN%22%3A%22%22%2C%22language%22%3A%22en%22%2C%22collections%22%3A%5B%5D%2C%22dateModified%22%3A%222022-10-03T02%3A03%3A59Z%22%7D%7D%2C%7B%22key%22%3A%22UDF2J5PL%22%2C%22library%22%3A%7B%22id%22%3A4800755%7D%2C%22meta%22%3A%7B%22creatorSummary%22%3A%22Catry%20et%20al.%22%2C%22parsedDate%22%3A%222018%22%2C%22numChildren%22%3A0%7D%2C%22bib%22%3A%22%26lt%3Bdiv%20class%3D%26quot%3Bcsl-bib-body%26quot%3B%20style%3D%26quot%3Bline-height%3A%202%3B%20padding-left%3A%201em%3B%20text-indent%3A-1em%3B%26quot%3B%26gt%3B%5Cn%20%20%26lt%3Bdiv%20class%3D%26quot%3Bcsl-entry%26quot%3B%26gt%3BCatry%2C%20T.%2C%20Li%2C%20Z.%2C%20Roux%2C%20E.%2C%20Herbreteau%2C%20V.%2C%20Gurgel%2C%20H.%2C%20Mangeas%2C%20M.%2C%20Seyler%2C%20F.%2C%20%26amp%3B%20Dessay%2C%20N.%20%282018%29.%20Wetlands%20and%20Malaria%20in%20the%20Amazon%3A%20Guidelines%20for%20the%20Use%20of%20Synthetic%20Aperture%20Radar%20Remote-Sensing.%20%26lt%3Bi%26gt%3BInternational%20Journal%20of%20Environmental%20Research%20and%20Public%20Health%26lt%3B%5C%2Fi%26gt%3B%2C%20%26lt%3Bi%26gt%3B15%26lt%3B%5C%2Fi%26gt%3B%283%29%2C%20468.%20%26lt%3Ba%20class%3D%26%23039%3Bzp-ItemURL%26%23039%3B%20target%3D%26%23039%3B_blank%26%23039%3B%20href%3D%26%23039%3Bhttp%3A%5C%2F%5C%2Fwww.mdpi.com%5C%2F1660-4601%5C%2F15%5C%2F3%5C%2F468%26%23039%3B%26gt%3Bhttp%3A%5C%2F%5C%2Fwww.mdpi.com%5C%2F1660-4601%5C%2F15%5C%2F3%5C%2F468%26lt%3B%5C%2Fa%26gt%3B%20%26lt%3Ba%20title%3D%26%23039%3BCite%20in%20RIS%20Format%26%23039%3B%20class%3D%26%23039%3Bzp-CiteRIS%26%23039%3B%20data-zp-cite%3D%26%23039%3Bapi_user_id%3D4800755%26amp%3Bitem_key%3DUDF2J5PL%26%23039%3B%20href%3D%26%23039%3Bjavascript%3Avoid%280%29%3B%26%23039%3B%26gt%3BCite%26lt%3B%5C%2Fa%26gt%3B%20%26lt%3B%5C%2Fdiv%26gt%3B%5Cn%26lt%3B%5C%2Fdiv%26gt%3B%22%2C%22data%22%3A%7B%22itemType%22%3A%22journalArticle%22%2C%22title%22%3A%22Wetlands%20and%20Malaria%20in%20the%20Amazon%3A%20Guidelines%20for%20the%20Use%20of%20Synthetic%20Aperture%20Radar%20Remote-Sensing%22%2C%22creators%22%3A%5B%7B%22creatorType%22%3A%22author%22%2C%22firstName%22%3A%22Thibault%22%2C%22lastName%22%3A%22Catry%22%7D%2C%7B%22creatorType%22%3A%22author%22%2C%22firstName%22%3A%22Zhichao%22%2C%22lastName%22%3A%22Li%22%7D%2C%7B%22creatorType%22%3A%22author%22%2C%22firstName%22%3A%22Emmanuel%22%2C%22lastName%22%3A%22Roux%22%7D%2C%7B%22creatorType%22%3A%22author%22%2C%22firstName%22%3A%22Vincent%22%2C%22lastName%22%3A%22Herbreteau%22%7D%2C%7B%22creatorType%22%3A%22author%22%2C%22firstName%22%3A%22Helen%22%2C%22lastName%22%3A%22Gurgel%22%7D%2C%7B%22creatorType%22%3A%22author%22%2C%22firstName%22%3A%22Morgan%22%2C%22lastName%22%3A%22Mangeas%22%7D%2C%7B%22creatorType%22%3A%22author%22%2C%22firstName%22%3A%22Fr%5Cu00e9d%5Cu00e9rique%22%2C%22lastName%22%3A%22Seyler%22%7D%2C%7B%22creatorType%22%3A%22author%22%2C%22firstName%22%3A%22Nadine%22%2C%22lastName%22%3A%22Dessay%22%7D%5D%2C%22abstractNote%22%3A%22%22%2C%22date%22%3A%222018%22%2C%22section%22%3A%22%22%2C%22partNumber%22%3A%22%22%2C%22partTitle%22%3A%22%22%2C%22DOI%22%3A%22%22%2C%22citationKey%22%3A%22%22%2C%22url%22%3A%22http%3A%5C%2F%5C%2Fwww.mdpi.com%5C%2F1660-4601%5C%2F15%5C%2F3%5C%2F468%22%2C%22PMID%22%3A%22%22%2C%22PMCID%22%3A%22%22%2C%22ISSN%22%3A%221660-4601%22%2C%22language%22%3A%22%22%2C%22collections%22%3A%5B%5D%2C%22dateModified%22%3A%222022-10-03T02%3A03%3A59Z%22%7D%7D%2C%7B%22key%22%3A%22MPWG8CXG%22%2C%22library%22%3A%7B%22id%22%3A4800755%7D%2C%22meta%22%3A%7B%22creatorSummary%22%3A%22Randrianaivo%20et%20al.%22%2C%22parsedDate%22%3A%222018%22%2C%22numChildren%22%3A0%7D%2C%22bib%22%3A%22%26lt%3Bdiv%20class%3D%26quot%3Bcsl-bib-body%26quot%3B%20style%3D%26quot%3Bline-height%3A%202%3B%20padding-left%3A%201em%3B%20text-indent%3A-1em%3B%26quot%3B%26gt%3B%5Cn%20%20%26lt%3Bdiv%20class%3D%26quot%3Bcsl-entry%26quot%3B%26gt%3BRandrianaivo%2C%20H.%2C%20Bertaut-Nativel%2C%20B.%2C%20Andr%26%23xE9%3B%2C%20M.%2C%20Irabe%2C%20M.%2C%20Robillard%2C%20P.-Y.%2C%20Boumahni%2C%20B.%2C%20Mangeas%2C%20M.%2C%20Roux%2C%20E.%2C%20Brou%2C%20T.%20Y.%2C%20G%26%23xE9%3Brardin%2C%20P.%2C%20Filleul%2C%20L.%2C%20%26amp%3B%20Herbreteau%2C%20V.%20%282018%29.%20Mise%20en%20place%20d%26%23x2019%3Bune%20surveillance%20spatialis%26%23xE9%3Be%20des%20malformations%20cong%26%23xE9%3Bnitales%20%26%23xE0%3B%20La%20R%26%23xE9%3Bunion%26%23x202F%3B%3A%20choix%20m%26%23xE9%3Bthodologiques.%20%26lt%3Bi%26gt%3BBulletin%20Epid%26%23xE9%3Bmiologique%20Hebdomadaire%26lt%3B%5C%2Fi%26gt%3B%2C%20%26lt%3Bi%26gt%3B2%26lt%3B%5C%2Fi%26gt%3B%2C%2038%26%23x2013%3B44.%20%26lt%3Ba%20class%3D%26%23039%3Bzp-ItemURL%26%23039%3B%20target%3D%26%23039%3B_blank%26%23039%3B%20href%3D%26%23039%3Bhttp%3A%5C%2F%5C%2Finvs.santepubliquefrance.fr%5C%2Fbeh%5C%2F2018%5C%2F2%5C%2F2018_2_2.html%26%23039%3B%26gt%3Bhttp%3A%5C%2F%5C%2Finvs.santepubliquefrance.fr%5C%2Fbeh%5C%2F2018%5C%2F2%5C%2F2018_2_2.html%26lt%3B%5C%2Fa%26gt%3B%20%26lt%3Ba%20title%3D%26%23039%3BCite%20in%20RIS%20Format%26%23039%3B%20class%3D%26%23039%3Bzp-CiteRIS%26%23039%3B%20data-zp-cite%3D%26%23039%3Bapi_user_id%3D4800755%26amp%3Bitem_key%3DMPWG8CXG%26%23039%3B%20href%3D%26%23039%3Bjavascript%3Avoid%280%29%3B%26%23039%3B%26gt%3BCite%26lt%3B%5C%2Fa%26gt%3B%20%26lt%3B%5C%2Fdiv%26gt%3B%5Cn%26lt%3B%5C%2Fdiv%26gt%3B%22%2C%22data%22%3A%7B%22itemType%22%3A%22journalArticle%22%2C%22title%22%3A%22Mise%20en%20place%20d%5Cu2019une%20surveillance%20spatialis%5Cu00e9e%20des%20malformations%20cong%5Cu00e9nitales%20%5Cu00e0%20La%20R%5Cu00e9union%20%3A%20choix%20m%5Cu00e9thodologiques%22%2C%22creators%22%3A%5B%7B%22creatorType%22%3A%22author%22%2C%22firstName%22%3A%22Hanitra%22%2C%22lastName%22%3A%22Randrianaivo%22%7D%2C%7B%22creatorType%22%3A%22author%22%2C%22firstName%22%3A%22B%5Cu00e9n%5Cu00e9dicte%22%2C%22lastName%22%3A%22Bertaut-Nativel%22%7D%2C%7B%22creatorType%22%3A%22author%22%2C%22firstName%22%3A%22Mathilde%22%2C%22lastName%22%3A%22Andr%5Cu00e9%22%7D%2C%7B%22creatorType%22%3A%22author%22%2C%22firstName%22%3A%22Mireille%22%2C%22lastName%22%3A%22Irabe%22%7D%2C%7B%22creatorType%22%3A%22author%22%2C%22firstName%22%3A%22Pierre-Yves%22%2C%22lastName%22%3A%22Robillard%22%7D%2C%7B%22creatorType%22%3A%22author%22%2C%22firstName%22%3A%22Brahim%22%2C%22lastName%22%3A%22Boumahni%22%7D%2C%7B%22creatorType%22%3A%22author%22%2C%22firstName%22%3A%22Morgan%22%2C%22lastName%22%3A%22Mangeas%22%7D%2C%7B%22creatorType%22%3A%22author%22%2C%22firstName%22%3A%22Emmanuel%22%2C%22lastName%22%3A%22Roux%22%7D%2C%7B%22creatorType%22%3A%22author%22%2C%22firstName%22%3A%22T%5Cu00e9lesphore%20Yao%22%2C%22lastName%22%3A%22Brou%22%7D%2C%7B%22creatorType%22%3A%22author%22%2C%22firstName%22%3A%22Patrick%22%2C%22lastName%22%3A%22G%5Cu00e9rardin%22%7D%2C%7B%22creatorType%22%3A%22author%22%2C%22firstName%22%3A%22Laurent%22%2C%22lastName%22%3A%22Filleul%22%7D%2C%7B%22creatorType%22%3A%22author%22%2C%22firstName%22%3A%22Vincent%22%2C%22lastName%22%3A%22Herbreteau%22%7D%5D%2C%22abstractNote%22%3A%22%22%2C%22date%22%3A%222018%22%2C%22section%22%3A%22%22%2C%22partNumber%22%3A%22%22%2C%22partTitle%22%3A%22%22%2C%22DOI%22%3A%22%22%2C%22citationKey%22%3A%22%22%2C%22url%22%3A%22http%3A%5C%2F%5C%2Finvs.santepubliquefrance.fr%5C%2Fbeh%5C%2F2018%5C%2F2%5C%2F2018_2_2.html%22%2C%22PMID%22%3A%22%22%2C%22PMCID%22%3A%22%22%2C%22ISSN%22%3A%22%22%2C%22language%22%3A%22%22%2C%22collections%22%3A%5B%5D%2C%22dateModified%22%3A%222022-10-03T02%3A03%3A59Z%22%7D%7D%2C%7B%22key%22%3A%229I6MQX79%22%2C%22library%22%3A%7B%22id%22%3A4800755%7D%2C%22meta%22%3A%7B%22creatorSummary%22%3A%22Owers%20et%20al.%22%2C%22parsedDate%22%3A%222017%22%2C%22numChildren%22%3A1%7D%2C%22bib%22%3A%22%26lt%3Bdiv%20class%3D%26quot%3Bcsl-bib-body%26quot%3B%20style%3D%26quot%3Bline-height%3A%202%3B%20padding-left%3A%201em%3B%20text-indent%3A-1em%3B%26quot%3B%26gt%3B%5Cn%20%20%26lt%3Bdiv%20class%3D%26quot%3Bcsl-entry%26quot%3B%26gt%3BOwers%2C%20K.%20A.%2C%20Hinjoy%2C%20S.%2C%20Childs%2C%20J.%20E.%2C%20Herbreteau%2C%20V.%2C%20Diggle%2C%20P.%20J.%2C%20%26amp%3B%20Ko%2C%20A.%20I.%20%282017%29.%20Timing%20and%20spatial%20heterogeneity%20of%20leptospirosis%20transmission%20in%20Northeast%20Thailand.%20%26lt%3Bi%26gt%3BAmerican%20Journal%20of%20Tropical%20Medicine%20and%20Hygiene%26lt%3B%5C%2Fi%26gt%3B%2C%20%26lt%3Bi%26gt%3B97%26lt%3B%5C%2Fi%26gt%3B%285%2C%20S%29%2C%20618.%20%26lt%3Ba%20title%3D%26%23039%3BCite%20in%20RIS%20Format%26%23039%3B%20class%3D%26%23039%3Bzp-CiteRIS%26%23039%3B%20data-zp-cite%3D%26%23039%3Bapi_user_id%3D4800755%26amp%3Bitem_key%3D9I6MQX79%26%23039%3B%20href%3D%26%23039%3Bjavascript%3Avoid%280%29%3B%26%23039%3B%26gt%3BCite%26lt%3B%5C%2Fa%26gt%3B%20%26lt%3B%5C%2Fdiv%26gt%3B%5Cn%26lt%3B%5C%2Fdiv%26gt%3B%22%2C%22data%22%3A%7B%22itemType%22%3A%22journalArticle%22%2C%22title%22%3A%22Timing%20and%20spatial%20heterogeneity%20of%20leptospirosis%20transmission%20in%20Northeast%20Thailand%22%2C%22creators%22%3A%5B%7B%22creatorType%22%3A%22author%22%2C%22firstName%22%3A%22Katharine%20A.%22%2C%22lastName%22%3A%22Owers%22%7D%2C%7B%22creatorType%22%3A%22author%22%2C%22firstName%22%3A%22Soawapak%22%2C%22lastName%22%3A%22Hinjoy%22%7D%2C%7B%22creatorType%22%3A%22author%22%2C%22firstName%22%3A%22James%20E.%22%2C%22lastName%22%3A%22Childs%22%7D%2C%7B%22creatorType%22%3A%22author%22%2C%22firstName%22%3A%22Vincent%22%2C%22lastName%22%3A%22Herbreteau%22%7D%2C%7B%22creatorType%22%3A%22author%22%2C%22firstName%22%3A%22Peter%20J.%22%2C%22lastName%22%3A%22Diggle%22%7D%2C%7B%22creatorType%22%3A%22author%22%2C%22firstName%22%3A%22Albert%20I.%22%2C%22lastName%22%3A%22Ko%22%7D%5D%2C%22abstractNote%22%3A%22%22%2C%22date%22%3A%222017%22%2C%22section%22%3A%22%22%2C%22partNumber%22%3A%22%22%2C%22partTitle%22%3A%22%22%2C%22DOI%22%3A%22%22%2C%22citationKey%22%3A%22%22%2C%22url%22%3A%22%22%2C%22PMID%22%3A%22%22%2C%22PMCID%22%3A%22%22%2C%22ISSN%22%3A%220002-9637%22%2C%22language%22%3A%22%22%2C%22collections%22%3A%5B%5D%2C%22dateModified%22%3A%222022-10-03T02%3A03%3A59Z%22%7D%7D%2C%7B%22key%22%3A%22J6D8R6BI%22%2C%22library%22%3A%7B%22id%22%3A4800755%7D%2C%22meta%22%3A%7B%22creatorSummary%22%3A%22Girond%20et%20al.%22%2C%22parsedDate%22%3A%222017%22%2C%22numChildren%22%3A0%7D%2C%22bib%22%3A%22%26lt%3Bdiv%20class%3D%26quot%3Bcsl-bib-body%26quot%3B%20style%3D%26quot%3Bline-height%3A%202%3B%20padding-left%3A%201em%3B%20text-indent%3A-1em%3B%26quot%3B%26gt%3B%5Cn%20%20%26lt%3Bdiv%20class%3D%26quot%3Bcsl-entry%26quot%3B%26gt%3BGirond%2C%20F.%2C%20Randrianasolo%2C%20L.%2C%20Randriamampionona%2C%20L.%2C%20Rakotomanana%2C%20F.%2C%20Randrianarivelojosia%2C%20M.%2C%20Ratsitorahina%2C%20M.%2C%20Brou%2C%20T.%20Y.%2C%20Herbreteau%2C%20V.%2C%20Mangeas%2C%20M.%2C%20Zigiumugabe%2C%20S.%2C%20Hedje%2C%20J.%2C%20Rogier%2C%20C.%2C%20%26amp%3B%20Piola%2C%20P.%20%282017%29.%20Analysing%20trends%20and%20forecasting%20malaria%20epidemics%20in%20Madagascar%20using%20a%20sentinel%20surveillance%20network%3A%20a%20web-based%20application.%20%26lt%3Bi%26gt%3BMalaria%20Journal%26lt%3B%5C%2Fi%26gt%3B%2C%20%26lt%3Bi%26gt%3B16%26lt%3B%5C%2Fi%26gt%3B%281%29%2C%2072.%20%26lt%3Ba%20class%3D%26%23039%3Bzp-DOIURL%26%23039%3B%20target%3D%26%23039%3B_blank%26%23039%3B%20href%3D%26%23039%3Bhttps%3A%5C%2F%5C%2Fdoi.org%5C%2F10.1186%5C%2Fs12936-017-1728-9%26%23039%3B%26gt%3Bhttps%3A%5C%2F%5C%2Fdoi.org%5C%2F10.1186%5C%2Fs12936-017-1728-9%26lt%3B%5C%2Fa%26gt%3B%20%26lt%3Ba%20title%3D%26%23039%3BCite%20in%20RIS%20Format%26%23039%3B%20class%3D%26%23039%3Bzp-CiteRIS%26%23039%3B%20data-zp-cite%3D%26%23039%3Bapi_user_id%3D4800755%26amp%3Bitem_key%3DJ6D8R6BI%26%23039%3B%20href%3D%26%23039%3Bjavascript%3Avoid%280%29%3B%26%23039%3B%26gt%3BCite%26lt%3B%5C%2Fa%26gt%3B%20%26lt%3B%5C%2Fdiv%26gt%3B%5Cn%26lt%3B%5C%2Fdiv%26gt%3B%22%2C%22data%22%3A%7B%22itemType%22%3A%22journalArticle%22%2C%22title%22%3A%22Analysing%20trends%20and%20forecasting%20malaria%20epidemics%20in%20Madagascar%20using%20a%20sentinel%20surveillance%20network%3A%20a%20web-based%20application%22%2C%22creators%22%3A%5B%7B%22creatorType%22%3A%22author%22%2C%22firstName%22%3A%22Florian%22%2C%22lastName%22%3A%22Girond%22%7D%2C%7B%22creatorType%22%3A%22author%22%2C%22firstName%22%3A%22Laurence%22%2C%22lastName%22%3A%22Randrianasolo%22%7D%2C%7B%22creatorType%22%3A%22author%22%2C%22firstName%22%3A%22Lea%22%2C%22lastName%22%3A%22Randriamampionona%22%7D%2C%7B%22creatorType%22%3A%22author%22%2C%22firstName%22%3A%22Fanjasoa%22%2C%22lastName%22%3A%22Rakotomanana%22%7D%2C%7B%22creatorType%22%3A%22author%22%2C%22firstName%22%3A%22Milijaona%22%2C%22lastName%22%3A%22Randrianarivelojosia%22%7D%2C%7B%22creatorType%22%3A%22author%22%2C%22firstName%22%3A%22Maherisoa%22%2C%22lastName%22%3A%22Ratsitorahina%22%7D%2C%7B%22creatorType%22%3A%22author%22%2C%22firstName%22%3A%22T%5Cu00e9lesphore%20Yao%22%2C%22lastName%22%3A%22Brou%22%7D%2C%7B%22creatorType%22%3A%22author%22%2C%22firstName%22%3A%22Vincent%22%2C%22lastName%22%3A%22Herbreteau%22%7D%2C%7B%22creatorType%22%3A%22author%22%2C%22firstName%22%3A%22Morgan%22%2C%22lastName%22%3A%22Mangeas%22%7D%2C%7B%22creatorType%22%3A%22author%22%2C%22firstName%22%3A%22Sixte%22%2C%22lastName%22%3A%22Zigiumugabe%22%7D%2C%7B%22creatorType%22%3A%22author%22%2C%22firstName%22%3A%22Judith%22%2C%22lastName%22%3A%22Hedje%22%7D%2C%7B%22creatorType%22%3A%22author%22%2C%22firstName%22%3A%22Christophe%22%2C%22lastName%22%3A%22Rogier%22%7D%2C%7B%22creatorType%22%3A%22author%22%2C%22firstName%22%3A%22Patrice%22%2C%22lastName%22%3A%22Piola%22%7D%5D%2C%22abstractNote%22%3A%22The%20use%20of%20a%20malaria%20early%20warning%20system%20%28MEWS%29%20to%20trigger%20prompt%20public%20health%20interventions%20is%20a%20key%20step%20in%20adding%20value%20to%20the%20epidemiological%20data%20routinely%20collected%20by%20sentinel%20surveillance%20systems.%22%2C%22date%22%3A%222017%22%2C%22section%22%3A%22%22%2C%22partNumber%22%3A%22%22%2C%22partTitle%22%3A%22%22%2C%22DOI%22%3A%2210.1186%5C%2Fs12936-017-1728-9%22%2C%22citationKey%22%3A%22%22%2C%22url%22%3A%22http%3A%5C%2F%5C%2Fdx.doi.org%5C%2F10.1186%5C%2Fs12936-017-1728-9%22%2C%22PMID%22%3A%22%22%2C%22PMCID%22%3A%22%22%2C%22ISSN%22%3A%221475-2875%22%2C%22language%22%3A%22%22%2C%22collections%22%3A%5B%5D%2C%22dateModified%22%3A%222022-10-03T02%3A03%3A59Z%22%7D%7D%2C%7B%22key%22%3A%22MCSTAKJH%22%2C%22library%22%3A%7B%22id%22%3A4800755%7D%2C%22meta%22%3A%7B%22creatorSummary%22%3A%22Ihantamalala%20et%20al.%22%2C%22parsedDate%22%3A%222016-04%22%2C%22numChildren%22%3A1%7D%2C%22bib%22%3A%22%26lt%3Bdiv%20class%3D%26quot%3Bcsl-bib-body%26quot%3B%20style%3D%26quot%3Bline-height%3A%202%3B%20padding-left%3A%201em%3B%20text-indent%3A-1em%3B%26quot%3B%26gt%3B%5Cn%20%20%26lt%3Bdiv%20class%3D%26quot%3Bcsl-entry%26quot%3B%26gt%3BIhantamalala%2C%20F.%20A.%2C%20Herbreteau%2C%20V.%2C%20Rakotondramanga%2C%20J.%20M.%2C%20Pennober%2C%20G.%2C%20Rahoilijaona%2C%20B.%2C%20Metcalf%2C%20C.%20J.%20E.%2C%20Buckee%2C%20C.%20O.%2C%20Rakotomanana%2C%20F.%2C%20Rogier%2C%20C.%2C%20%26amp%3B%20Wesolowski%2C%20A.%20%282016%29.%20Spatiotemporal%20epidemiology%20of%20malaria%20in%20Madagascar%20between%202006%20and%202015.%20%26lt%3Bi%26gt%3BInternational%20Journal%20of%20Infectious%20Diseases%26lt%3B%5C%2Fi%26gt%3B%2C%20%26lt%3Bi%26gt%3B45%26lt%3B%5C%2Fi%26gt%3B%2C%2058%26%23x2013%3B59.%20%26lt%3Ba%20class%3D%26%23039%3Bzp-DOIURL%26%23039%3B%20target%3D%26%23039%3B_blank%26%23039%3B%20href%3D%26%23039%3Bhttps%3A%5C%2F%5C%2Fdoi.org%5C%2F10.1016%5C%2Fj.ijid.2016.02.173%26%23039%3B%26gt%3Bhttps%3A%5C%2F%5C%2Fdoi.org%5C%2F10.1016%5C%2Fj.ijid.2016.02.173%26lt%3B%5C%2Fa%26gt%3B%20%26lt%3Ba%20title%3D%26%23039%3BCite%20in%20RIS%20Format%26%23039%3B%20class%3D%26%23039%3Bzp-CiteRIS%26%23039%3B%20data-zp-cite%3D%26%23039%3Bapi_user_id%3D4800755%26amp%3Bitem_key%3DMCSTAKJH%26%23039%3B%20href%3D%26%23039%3Bjavascript%3Avoid%280%29%3B%26%23039%3B%26gt%3BCite%26lt%3B%5C%2Fa%26gt%3B%20%26lt%3B%5C%2Fdiv%26gt%3B%5Cn%26lt%3B%5C%2Fdiv%26gt%3B%22%2C%22data%22%3A%7B%22itemType%22%3A%22journalArticle%22%2C%22title%22%3A%22Spatiotemporal%20epidemiology%20of%20malaria%20in%20Madagascar%20between%202006%20and%202015%22%2C%22creators%22%3A%5B%7B%22creatorType%22%3A%22author%22%2C%22firstName%22%3A%22F.%20A.%22%2C%22lastName%22%3A%22Ihantamalala%22%7D%2C%7B%22creatorType%22%3A%22author%22%2C%22firstName%22%3A%22V.%22%2C%22lastName%22%3A%22Herbreteau%22%7D%2C%7B%22creatorType%22%3A%22author%22%2C%22firstName%22%3A%22J.%20M.%22%2C%22lastName%22%3A%22Rakotondramanga%22%7D%2C%7B%22creatorType%22%3A%22author%22%2C%22firstName%22%3A%22G.%22%2C%22lastName%22%3A%22Pennober%22%7D%2C%7B%22creatorType%22%3A%22author%22%2C%22firstName%22%3A%22B.%22%2C%22lastName%22%3A%22Rahoilijaona%22%7D%2C%7B%22creatorType%22%3A%22author%22%2C%22firstName%22%3A%22C.%20J.%20E.%22%2C%22lastName%22%3A%22Metcalf%22%7D%2C%7B%22creatorType%22%3A%22author%22%2C%22firstName%22%3A%22C.%20O.%22%2C%22lastName%22%3A%22Buckee%22%7D%2C%7B%22creatorType%22%3A%22author%22%2C%22firstName%22%3A%22F.%22%2C%22lastName%22%3A%22Rakotomanana%22%7D%2C%7B%22creatorType%22%3A%22author%22%2C%22firstName%22%3A%22C.%22%2C%22lastName%22%3A%22Rogier%22%7D%2C%7B%22creatorType%22%3A%22author%22%2C%22firstName%22%3A%22A.%22%2C%22lastName%22%3A%22Wesolowski%22%7D%5D%2C%22abstractNote%22%3A%22%22%2C%22date%22%3A%222016%20Apr%22%2C%22section%22%3A%22%22%2C%22partNumber%22%3A%22%22%2C%22partTitle%22%3A%22%22%2C%22DOI%22%3A%2210.1016%5C%2Fj.ijid.2016.02.173%22%2C%22citationKey%22%3A%22%22%2C%22url%22%3A%22%3A%5C%2F%5C%2FWOS%3A000374876700119%20http%3A%5C%2F%5C%2Fac.els-cdn.com%5C%2FS1201971216301527%5C%2F1-s2.0-S1201971216301527-main.pdf%3F_tid%3D5202419a-8c8d-11e6-8d03-00000aacb35e%26acdnat%3D1475845107_82aed1879e2aafd5a6cdee414ffcb8b6%22%2C%22PMID%22%3A%22%22%2C%22PMCID%22%3A%22%22%2C%22ISSN%22%3A%221201-9712%22%2C%22language%22%3A%22English%22%2C%22collections%22%3A%5B%5D%2C%22dateModified%22%3A%222022-10-03T02%3A03%3A59Z%22%7D%7D%2C%7B%22key%22%3A%22VMRZWAYD%22%2C%22library%22%3A%7B%22id%22%3A4800755%7D%2C%22meta%22%3A%7B%22creatorSummary%22%3A%22Tran%20et%20al.%22%2C%22parsedDate%22%3A%222016%22%2C%22numChildren%22%3A0%7D%2C%22bib%22%3A%22%26lt%3Bdiv%20class%3D%26quot%3Bcsl-bib-body%26quot%3B%20style%3D%26quot%3Bline-height%3A%202%3B%20padding-left%3A%201em%3B%20text-indent%3A-1em%3B%26quot%3B%26gt%3B%5Cn%20%20%26lt%3Bdiv%20class%3D%26quot%3Bcsl-entry%26quot%3B%26gt%3BTran%2C%20A.%2C%20Kassi%26%23xE9%3B%2C%20D.%2C%20%26amp%3B%20Herbreteau%2C%20V.%20%282016%29.%20Applications%20of%20Remote%20Sensing%20to%20the%20Epidemiology%20of%20Infectious%20Diseases%3A%20Some%20Examples.%20In%20N.%20Baghdadi%20%26amp%3B%20M.%20Zribi%20%28Eds.%29%2C%20%26lt%3Bi%26gt%3BLand%20Surface%20Remote%20Sensing%3A%20Environment%20and%20Risks%26lt%3B%5C%2Fi%26gt%3B%20%28pp.%20295%26%23x2013%3B315%29.%20Elsevier.%20%26lt%3Ba%20title%3D%26%23039%3BCite%20in%20RIS%20Format%26%23039%3B%20class%3D%26%23039%3Bzp-CiteRIS%26%23039%3B%20data-zp-cite%3D%26%23039%3Bapi_user_id%3D4800755%26amp%3Bitem_key%3DVMRZWAYD%26%23039%3B%20href%3D%26%23039%3Bjavascript%3Avoid%280%29%3B%26%23039%3B%26gt%3BCite%26lt%3B%5C%2Fa%26gt%3B%20%26lt%3B%5C%2Fdiv%26gt%3B%5Cn%26lt%3B%5C%2Fdiv%26gt%3B%22%2C%22data%22%3A%7B%22itemType%22%3A%22bookSection%22%2C%22title%22%3A%22Applications%20of%20Remote%20Sensing%20to%20the%20Epidemiology%20of%20Infectious%20Diseases%3A%20Some%20Examples%22%2C%22creators%22%3A%5B%7B%22creatorType%22%3A%22editor%22%2C%22firstName%22%3A%22Nicolas%22%2C%22lastName%22%3A%22Baghdadi%22%7D%2C%7B%22creatorType%22%3A%22editor%22%2C%22firstName%22%3A%22Mehrez%22%2C%22lastName%22%3A%22Zribi%22%7D%2C%7B%22creatorType%22%3A%22author%22%2C%22firstName%22%3A%22Annelise%22%2C%22lastName%22%3A%22Tran%22%7D%2C%7B%22creatorType%22%3A%22author%22%2C%22firstName%22%3A%22Daouda%22%2C%22lastName%22%3A%22Kassi%5Cu00e9%22%7D%2C%7B%22creatorType%22%3A%22author%22%2C%22firstName%22%3A%22Vincent%22%2C%22lastName%22%3A%22Herbreteau%22%7D%5D%2C%22abstractNote%22%3A%22%22%2C%22bookTitle%22%3A%22Land%20Surface%20Remote%20Sensing%3A%20Environment%20and%20Risks%22%2C%22date%22%3A%222016%22%2C%22originalDate%22%3A%22%22%2C%22originalPublisher%22%3A%22%22%2C%22originalPlace%22%3A%22%22%2C%22format%22%3A%22%22%2C%22ISBN%22%3A%221-78548-105-3%22%2C%22DOI%22%3A%22%22%2C%22citationKey%22%3A%22%22%2C%22url%22%3A%22%22%2C%22ISSN%22%3A%22%22%2C%22language%22%3A%22%22%2C%22collections%22%3A%5B%5D%2C%22dateModified%22%3A%222022-10-03T02%3A03%3A59Z%22%7D%7D%2C%7B%22key%22%3A%22CHYVS84K%22%2C%22library%22%3A%7B%22id%22%3A4800755%7D%2C%22meta%22%3A%7B%22creatorSummary%22%3A%22Andr%5Cu00e9%20et%20al.%22%2C%22parsedDate%22%3A%222016%22%2C%22numChildren%22%3A0%7D%2C%22bib%22%3A%22%26lt%3Bdiv%20class%3D%26quot%3Bcsl-bib-body%26quot%3B%20style%3D%26quot%3Bline-height%3A%202%3B%20padding-left%3A%201em%3B%20text-indent%3A-1em%3B%26quot%3B%26gt%3B%5Cn%20%20%26lt%3Bdiv%20class%3D%26quot%3Bcsl-entry%26quot%3B%26gt%3BAndr%26%23xE9%3B%2C%20M.%2C%20Randrianaivo%2C%20H.%2C%20Bertaud-Nativel%2C%20B.%2C%20%26amp%3B%20Herbreteau%2C%20V.%20%282016%29.%20Spatial%20investigation%20of%20congenital%20malformations%20in%20Reunion%20Island%20%282008-2012%29.%20%26lt%3Bi%26gt%3BBirth%20Defects%20Research%20Part%20A%3A%20Clinical%20and%20Molecular%20Teratology%26lt%3B%5C%2Fi%26gt%3B%2C%20%26lt%3Bi%26gt%3B106%26lt%3B%5C%2Fi%26gt%3B%2C%20509%26%23x2013%3B509.%20%26lt%3Ba%20title%3D%26%23039%3BCite%20in%20RIS%20Format%26%23039%3B%20class%3D%26%23039%3Bzp-CiteRIS%26%23039%3B%20data-zp-cite%3D%26%23039%3Bapi_user_id%3D4800755%26amp%3Bitem_key%3DCHYVS84K%26%23039%3B%20href%3D%26%23039%3Bjavascript%3Avoid%280%29%3B%26%23039%3B%26gt%3BCite%26lt%3B%5C%2Fa%26gt%3B%20%26lt%3B%5C%2Fdiv%26gt%3B%5Cn%26lt%3B%5C%2Fdiv%26gt%3B%22%2C%22data%22%3A%7B%22itemType%22%3A%22conferencePaper%22%2C%22title%22%3A%22Spatial%20investigation%20of%20congenital%20malformations%20in%20Reunion%20Island%20%282008-2012%29%22%2C%22creators%22%3A%5B%7B%22creatorType%22%3A%22author%22%2C%22firstName%22%3A%22Mathilde%22%2C%22lastName%22%3A%22Andr%5Cu00e9%22%7D%2C%7B%22creatorType%22%3A%22author%22%2C%22firstName%22%3A%22Hanitra%22%2C%22lastName%22%3A%22Randrianaivo%22%7D%2C%7B%22creatorType%22%3A%22author%22%2C%22firstName%22%3A%22B%5Cu00e9n%5Cu00e9dicte%22%2C%22lastName%22%3A%22Bertaud-Nativel%22%7D%2C%7B%22creatorType%22%3A%22author%22%2C%22firstName%22%3A%22Vincent%22%2C%22lastName%22%3A%22Herbreteau%22%7D%5D%2C%22abstractNote%22%3A%22%22%2C%22proceedingsTitle%22%3A%22Birth%20Defects%20Research%20Part%20A%3A%20Clinical%20and%20Molecular%20Teratology%22%2C%22conferenceName%22%3A%2213th%20EUROCAT%20SCIENTIFIC%20SYMPOSIUM%3A%20Advancing%20congenital%20anomaly%20research%20through%20collaboration%22%2C%22date%22%3A%222016%22%2C%22DOI%22%3A%22%22%2C%22ISBN%22%3A%221542-0752%22%2C%22citationKey%22%3A%22%22%2C%22url%22%3A%22%22%2C%22ISSN%22%3A%22%22%2C%22language%22%3A%22%22%2C%22collections%22%3A%5B%5D%2C%22dateModified%22%3A%222022-10-03T02%3A03%3A59Z%22%7D%7D%2C%7B%22key%22%3A%22KMRLI7YA%22%2C%22library%22%3A%7B%22id%22%3A4800755%7D%2C%22meta%22%3A%7B%22creatorSummary%22%3A%22Attoumane%20et%20al.%22%2C%22parsedDate%22%3A%222015-09%22%2C%22numChildren%22%3A1%7D%2C%22bib%22%3A%22%26lt%3Bdiv%20class%3D%26quot%3Bcsl-bib-body%26quot%3B%20style%3D%26quot%3Bline-height%3A%202%3B%20padding-left%3A%201em%3B%20text-indent%3A-1em%3B%26quot%3B%26gt%3B%5Cn%20%20%26lt%3Bdiv%20class%3D%26quot%3Bcsl-entry%26quot%3B%26gt%3BAttoumane%2C%20A.%2C%20Silai%2C%20R.%2C%20Bacar%2C%20A.%2C%20Revillion%2C%20C.%2C%20Cardinale%2C%20E.%2C%20Pennober%2C%20G.%2C%20%26amp%3B%20Herbreteau%2C%20V.%20%282015%29.%20Spatial%20analysis%20of%20malaria%20distribution%20in%20the%20Union%20of%20Comoros.%20%26lt%3Bi%26gt%3BTropical%20Medicine%20%26amp%3B%20International%20Health%26lt%3B%5C%2Fi%26gt%3B%2C%20%26lt%3Bi%26gt%3B20%26lt%3B%5C%2Fi%26gt%3B%2C%20224%26%23x2013%3B224.%20%26lt%3Ba%20class%3D%26%23039%3Bzp-ItemURL%26%23039%3B%20target%3D%26%23039%3B_blank%26%23039%3B%20href%3D%26%23039%3B%3A%5C%2F%5C%2FWOS%3A000360758801136%26%23039%3B%26gt%3B%3A%5C%2F%5C%2FWOS%3A000360758801136%26lt%3B%5C%2Fa%26gt%3B%20%26lt%3Ba%20title%3D%26%23039%3BCite%20in%20RIS%20Format%26%23039%3B%20class%3D%26%23039%3Bzp-CiteRIS%26%23039%3B%20data-zp-cite%3D%26%23039%3Bapi_user_id%3D4800755%26amp%3Bitem_key%3DKMRLI7YA%26%23039%3B%20href%3D%26%23039%3Bjavascript%3Avoid%280%29%3B%26%23039%3B%26gt%3BCite%26lt%3B%5C%2Fa%26gt%3B%20%26lt%3B%5C%2Fdiv%26gt%3B%5Cn%26lt%3B%5C%2Fdiv%26gt%3B%22%2C%22data%22%3A%7B%22itemType%22%3A%22journalArticle%22%2C%22title%22%3A%22Spatial%20analysis%20of%20malaria%20distribution%20in%20the%20Union%20of%20Comoros%22%2C%22creators%22%3A%5B%7B%22creatorType%22%3A%22author%22%2C%22firstName%22%3A%22A.%22%2C%22lastName%22%3A%22Attoumane%22%7D%2C%7B%22creatorType%22%3A%22author%22%2C%22firstName%22%3A%22R.%22%2C%22lastName%22%3A%22Silai%22%7D%2C%7B%22creatorType%22%3A%22author%22%2C%22firstName%22%3A%22A.%22%2C%22lastName%22%3A%22Bacar%22%7D%2C%7B%22creatorType%22%3A%22author%22%2C%22firstName%22%3A%22C.%22%2C%22lastName%22%3A%22Revillion%22%7D%2C%7B%22creatorType%22%3A%22author%22%2C%22firstName%22%3A%22E.%22%2C%22lastName%22%3A%22Cardinale%22%7D%2C%7B%22creatorType%22%3A%22author%22%2C%22firstName%22%3A%22G.%22%2C%22lastName%22%3A%22Pennober%22%7D%2C%7B%22creatorType%22%3A%22author%22%2C%22firstName%22%3A%22V.%22%2C%22lastName%22%3A%22Herbreteau%22%7D%5D%2C%22abstractNote%22%3A%22%22%2C%22date%22%3A%222015%20Sep%22%2C%22section%22%3A%22%22%2C%22partNumber%22%3A%22%22%2C%22partTitle%22%3A%22%22%2C%22DOI%22%3A%22%22%2C%22citationKey%22%3A%22%22%2C%22url%22%3A%22%3A%5C%2F%5C%2FWOS%3A000360758801136%22%2C%22PMID%22%3A%22%22%2C%22PMCID%22%3A%22%22%2C%22ISSN%22%3A%221360-2276%22%2C%22language%22%3A%22English%22%2C%22collections%22%3A%5B%5D%2C%22dateModified%22%3A%222022-10-03T02%3A03%3A59Z%22%7D%7D%2C%7B%22key%22%3A%22W77RLP5G%22%2C%22library%22%3A%7B%22id%22%3A4800755%7D%2C%22meta%22%3A%7B%22creatorSummary%22%3A%22Bordes%20et%20al.%22%2C%22parsedDate%22%3A%222015-09%22%2C%22numChildren%22%3A1%7D%2C%22bib%22%3A%22%26lt%3Bdiv%20class%3D%26quot%3Bcsl-bib-body%26quot%3B%20style%3D%26quot%3Bline-height%3A%202%3B%20padding-left%3A%201em%3B%20text-indent%3A-1em%3B%26quot%3B%26gt%3B%5Cn%20%20%26lt%3Bdiv%20class%3D%26quot%3Bcsl-entry%26quot%3B%26gt%3BBordes%2C%20F.%2C%20Morand%2C%20S.%2C%20Pilosof%2C%20S.%2C%20Claude%2C%20J.%2C%20Krasnov%2C%20B.%20R.%2C%20Cosson%2C%20J.%20F.%2C%20Chaval%2C%20Y.%2C%20Ribas%2C%20A.%2C%20Chaisiri%2C%20K.%2C%20Blasdell%2C%20K.%2C%20Herbreteau%2C%20V.%2C%20Dupuy%2C%20S.%2C%20%26amp%3B%20Tran%2C%20A.%20%282015%29.%20Habitat%20fragmentation%20alters%20the%20properties%20of%20a%20host-parasite%20network%3A%20rodents%20and%20their%20helminths%20in%20South-East%20Asia.%20%26lt%3Bi%26gt%3BJournal%20of%20Animal%20Ecology%26lt%3B%5C%2Fi%26gt%3B%2C%20%26lt%3Bi%26gt%3B84%26lt%3B%5C%2Fi%26gt%3B%285%29%2C%201253%26%23x2013%3B1263.%20%26lt%3Ba%20class%3D%26%23039%3Bzp-DOIURL%26%23039%3B%20target%3D%26%23039%3B_blank%26%23039%3B%20href%3D%26%23039%3Bhttps%3A%5C%2F%5C%2Fdoi.org%5C%2F10.1111%5C%2F1365-2656.12368%26%23039%3B%26gt%3Bhttps%3A%5C%2F%5C%2Fdoi.org%5C%2F10.1111%5C%2F1365-2656.12368%26lt%3B%5C%2Fa%26gt%3B%20%26lt%3Ba%20title%3D%26%23039%3BCite%20in%20RIS%20Format%26%23039%3B%20class%3D%26%23039%3Bzp-CiteRIS%26%23039%3B%20data-zp-cite%3D%26%23039%3Bapi_user_id%3D4800755%26amp%3Bitem_key%3DW77RLP5G%26%23039%3B%20href%3D%26%23039%3Bjavascript%3Avoid%280%29%3B%26%23039%3B%26gt%3BCite%26lt%3B%5C%2Fa%26gt%3B%20%26lt%3B%5C%2Fdiv%26gt%3B%5Cn%26lt%3B%5C%2Fdiv%26gt%3B%22%2C%22data%22%3A%7B%22itemType%22%3A%22journalArticle%22%2C%22title%22%3A%22Habitat%20fragmentation%20alters%20the%20properties%20of%20a%20host-parasite%20network%3A%20rodents%20and%20their%20helminths%20in%20South-East%20Asia%22%2C%22creators%22%3A%5B%7B%22creatorType%22%3A%22author%22%2C%22firstName%22%3A%22F.%22%2C%22lastName%22%3A%22Bordes%22%7D%2C%7B%22creatorType%22%3A%22author%22%2C%22firstName%22%3A%22S.%22%2C%22lastName%22%3A%22Morand%22%7D%2C%7B%22creatorType%22%3A%22author%22%2C%22firstName%22%3A%22S.%22%2C%22lastName%22%3A%22Pilosof%22%7D%2C%7B%22creatorType%22%3A%22author%22%2C%22firstName%22%3A%22J.%22%2C%22lastName%22%3A%22Claude%22%7D%2C%7B%22creatorType%22%3A%22author%22%2C%22firstName%22%3A%22B.%20R.%22%2C%22lastName%22%3A%22Krasnov%22%7D%2C%7B%22creatorType%22%3A%22author%22%2C%22firstName%22%3A%22J.%20F.%22%2C%22lastName%22%3A%22Cosson%22%7D%2C%7B%22creatorType%22%3A%22author%22%2C%22firstName%22%3A%22Y.%22%2C%22lastName%22%3A%22Chaval%22%7D%2C%7B%22creatorType%22%3A%22author%22%2C%22firstName%22%3A%22A.%22%2C%22lastName%22%3A%22Ribas%22%7D%2C%7B%22creatorType%22%3A%22author%22%2C%22firstName%22%3A%22K.%22%2C%22lastName%22%3A%22Chaisiri%22%7D%2C%7B%22creatorType%22%3A%22author%22%2C%22firstName%22%3A%22K.%22%2C%22lastName%22%3A%22Blasdell%22%7D%2C%7B%22creatorType%22%3A%22author%22%2C%22firstName%22%3A%22V.%22%2C%22lastName%22%3A%22Herbreteau%22%7D%2C%7B%22creatorType%22%3A%22author%22%2C%22firstName%22%3A%22S.%22%2C%22lastName%22%3A%22Dupuy%22%7D%2C%7B%22creatorType%22%3A%22author%22%2C%22firstName%22%3A%22A.%22%2C%22lastName%22%3A%22Tran%22%7D%5D%2C%22abstractNote%22%3A%22While%20the%20effects%20of%20deforestation%20and%20habitat%20fragmentation%20on%20parasite%20prevalence%20or%20richness%20are%20well%20investigated%2C%20host-parasite%20networks%20are%20still%20understudied%20despite%20their%20importance%20in%20understanding%20the%20mechanisms%20of%20these%20major%20disturbances.%20Because%20fragmentation%20may%20negatively%20impact%20species%20occupancy%2C%20abundance%20and%20co-occurrence%2C%20we%20predict%20a%20link%20between%20spatiotemporal%20changes%20in%20habitat%20and%20the%20architecture%20of%20host-parasite%20networks.%20For%20this%2C%20we%20used%20an%20extensive%20data%20set%20on%2016%20rodent%20species%20and%2029%20helminth%20species%20from%20seven%20localities%20of%20South-East%20Asia.%20We%20analysed%20the%20effects%20of%20rapid%20deforestation%20on%20connectance%20and%20modularity%20of%20helminth-parasite%20networks.%20We%20estimated%20both%20the%20degree%20of%20fragmentation%20and%20the%20rate%20of%20deforestation%20through%20the%20development%20of%20land%20uses%20and%20their%20changes%20through%20the%20last%2020%20to%2030years%20in%20order%20to%20take%20into%20account%20the%20dynamics%20of%20habitat%20fragmentation%20in%20our%20statistical%20analyses.%20We%20found%20that%20rapid%20fragmentation%20does%20not%20affect%20helminth%20species%20richness%20per%20se%20but%20impacts%20host-parasite%20interactions%20as%20the%20rodent-helminth%20network%20becomes%20less%20connected%20and%20more%20modular.%20Our%20results%20suggest%20that%20parasite%20sharing%20among%20host%20species%20may%20become%20more%20difficult%20to%20maintain%20with%20the%20increase%20of%20habitat%20disturbance.%22%2C%22date%22%3A%222015%20Sep%22%2C%22section%22%3A%22%22%2C%22partNumber%22%3A%22%22%2C%22partTitle%22%3A%22%22%2C%22DOI%22%3A%2210.1111%5C%2F1365-2656.12368%22%2C%22citationKey%22%3A%22%22%2C%22url%22%3A%22%3A%5C%2F%5C%2FWOS%3A000360093400012%20http%3A%5C%2F%5C%2Fonlinelibrary.wiley.com%5C%2Fstore%5C%2F10.1111%5C%2F1365-2656.12368%5C%2Fasset%5C%2Fjane12368.pdf%3Fv%3D1%26t%3Dimpzs7zz%26s%3D49b59b9a983d5284c0a2ca7507bdcf7b65982cda%22%2C%22PMID%22%3A%22%22%2C%22PMCID%22%3A%22%22%2C%22ISSN%22%3A%220021-8790%22%2C%22language%22%3A%22English%22%2C%22collections%22%3A%5B%5D%2C%22dateModified%22%3A%222022-10-03T02%3A03%3A59Z%22%7D%7D%2C%7B%22key%22%3A%222CE5AIRM%22%2C%22library%22%3A%7B%22id%22%3A4800755%7D%2C%22meta%22%3A%7B%22creatorSummary%22%3A%22Herbreteau%20et%20al.%22%2C%22parsedDate%22%3A%222015%22%2C%22numChildren%22%3A0%7D%2C%22bib%22%3A%22%26lt%3Bdiv%20class%3D%26quot%3Bcsl-bib-body%26quot%3B%20style%3D%26quot%3Bline-height%3A%202%3B%20padding-left%3A%201em%3B%20text-indent%3A-1em%3B%26quot%3B%26gt%3B%5Cn%20%20%26lt%3Bdiv%20class%3D%26quot%3Bcsl-entry%26quot%3B%26gt%3BHerbreteau%2C%20V.%2C%20Tantrakarnapa%2C%20K.%2C%20Khaungaew%2C%20W.%2C%20%26amp%3B%20Janeau%2C%20J.-L.%20%282015%29.%20Water%20and%20Health%3A%20What%20Is%20the%20Risk%20and%20Visible%20Burden%20of%20the%20Exposure%20to%20Environmental%20Contaminations%3F%20Insights%20from%20a%20Questionnaire-Based%20Survey%20in%20Northern%20Thailand.%20In%20S.%20Morand%2C%20J.-P.%20Dujardin%2C%20R.%20Lefait-Robin%2C%20%26amp%3B%20C.%20Apiwathnasorn%20%28Eds.%29%2C%20%26lt%3Bi%26gt%3BSocio-Ecological%20Dimensions%20of%20Infectious%20Diseases%20in%20Southeast%20Asia%26lt%3B%5C%2Fi%26gt%3B%20%28pp.%2075%26%23x2013%3B88%29.%20Springer%20Singapore.%20https%3A%5C%2F%5C%2Fdoi.org%5C%2F10.1007%5C%2F978-981-287-527-3_6%20%26lt%3Ba%20title%3D%26%23039%3BCite%20in%20RIS%20Format%26%23039%3B%20class%3D%26%23039%3Bzp-CiteRIS%26%23039%3B%20data-zp-cite%3D%26%23039%3Bapi_user_id%3D4800755%26amp%3Bitem_key%3D2CE5AIRM%26%23039%3B%20href%3D%26%23039%3Bjavascript%3Avoid%280%29%3B%26%23039%3B%26gt%3BCite%26lt%3B%5C%2Fa%26gt%3B%20%26lt%3B%5C%2Fdiv%26gt%3B%5Cn%26lt%3B%5C%2Fdiv%26gt%3B%22%2C%22data%22%3A%7B%22itemType%22%3A%22bookSection%22%2C%22title%22%3A%22Water%20and%20Health%3A%20What%20Is%20the%20Risk%20and%20Visible%20Burden%20of%20the%20Exposure%20to%20Environmental%20Contaminations%3F%20Insights%20from%20a%20Questionnaire-Based%20Survey%20in%20Northern%20Thailand%22%2C%22creators%22%3A%5B%7B%22creatorType%22%3A%22editor%22%2C%22firstName%22%3A%22Serge%22%2C%22lastName%22%3A%22Morand%22%7D%2C%7B%22creatorType%22%3A%22editor%22%2C%22firstName%22%3A%22Jean-Pierre%22%2C%22lastName%22%3A%22Dujardin%22%7D%2C%7B%22creatorType%22%3A%22editor%22%2C%22firstName%22%3A%22R%5Cu00e9gine%22%2C%22lastName%22%3A%22Lefait-Robin%22%7D%2C%7B%22creatorType%22%3A%22editor%22%2C%22firstName%22%3A%22Chamnarn%22%2C%22lastName%22%3A%22Apiwathnasorn%22%7D%2C%7B%22creatorType%22%3A%22author%22%2C%22firstName%22%3A%22Vincent%22%2C%22lastName%22%3A%22Herbreteau%22%7D%2C%7B%22creatorType%22%3A%22author%22%2C%22firstName%22%3A%22Kraichat%22%2C%22lastName%22%3A%22Tantrakarnapa%22%7D%2C%7B%22creatorType%22%3A%22author%22%2C%22firstName%22%3A%22Wasana%22%2C%22lastName%22%3A%22Khaungaew%22%7D%2C%7B%22creatorType%22%3A%22author%22%2C%22firstName%22%3A%22Jean-Louis%22%2C%22lastName%22%3A%22Janeau%22%7D%5D%2C%22abstractNote%22%3A%22%22%2C%22bookTitle%22%3A%22Socio-Ecological%20Dimensions%20of%20Infectious%20Diseases%20in%20Southeast%20Asia%22%2C%22date%22%3A%222015%22%2C%22originalDate%22%3A%22%22%2C%22originalPublisher%22%3A%22%22%2C%22originalPlace%22%3A%22%22%2C%22format%22%3A%22%22%2C%22ISBN%22%3A%22978-981-287-526-6%20978-981-287-527-3%22%2C%22DOI%22%3A%22%22%2C%22citationKey%22%3A%22%22%2C%22url%22%3A%22http%3A%5C%2F%5C%2Flink.springer.com%5C%2F10.1007%5C%2F978-981-287-527-3_6%22%2C%22ISSN%22%3A%22%22%2C%22language%22%3A%22en%22%2C%22collections%22%3A%5B%5D%2C%22dateModified%22%3A%222022-10-03T02%3A03%3A59Z%22%7D%7D%2C%7B%22key%22%3A%22XXDBKCMH%22%2C%22library%22%3A%7B%22id%22%3A4800755%7D%2C%22meta%22%3A%7B%22creatorSummary%22%3A%22Latinne%20et%20al.%22%2C%22parsedDate%22%3A%222015%22%2C%22numChildren%22%3A0%7D%2C%22bib%22%3A%22%26lt%3Bdiv%20class%3D%26quot%3Bcsl-bib-body%26quot%3B%20style%3D%26quot%3Bline-height%3A%202%3B%20padding-left%3A%201em%3B%20text-indent%3A-1em%3B%26quot%3B%26gt%3B%5Cn%20%20%26lt%3Bdiv%20class%3D%26quot%3Bcsl-entry%26quot%3B%26gt%3BLatinne%2C%20A.%2C%20Meynard%2C%20C.%20N.%2C%20Herbreteau%2C%20V.%2C%20Waengsothorn%2C%20S.%2C%20Morand%2C%20S.%2C%20%26amp%3B%20Michaux%2C%20J.%20R.%20%282015%29.%20Influence%20of%20past%20and%20future%20climate%20changes%20on%20the%20distribution%20of%20three%20Southeast%20Asian%20murine%20rodents.%20%26lt%3Bi%26gt%3BJournal%20of%20Biogeography%26lt%3B%5C%2Fi%26gt%3B%2C%20%26lt%3Bi%26gt%3B42%26lt%3B%5C%2Fi%26gt%3B%289%29%2C%201714%26%23x2013%3B1726.%20%26lt%3Ba%20class%3D%26%23039%3Bzp-DOIURL%26%23039%3B%20target%3D%26%23039%3B_blank%26%23039%3B%20href%3D%26%23039%3Bhttps%3A%5C%2F%5C%2Fdoi.org%5C%2F10.1111%5C%2Fjbi.12528%26%23039%3B%26gt%3Bhttps%3A%5C%2F%5C%2Fdoi.org%5C%2F10.1111%5C%2Fjbi.12528%26lt%3B%5C%2Fa%26gt%3B%20%26lt%3Ba%20title%3D%26%23039%3BCite%20in%20RIS%20Format%26%23039%3B%20class%3D%26%23039%3Bzp-CiteRIS%26%23039%3B%20data-zp-cite%3D%26%23039%3Bapi_user_id%3D4800755%26amp%3Bitem_key%3DXXDBKCMH%26%23039%3B%20href%3D%26%23039%3Bjavascript%3Avoid%280%29%3B%26%23039%3B%26gt%3BCite%26lt%3B%5C%2Fa%26gt%3B%20%26lt%3B%5C%2Fdiv%26gt%3B%5Cn%26lt%3B%5C%2Fdiv%26gt%3B%22%2C%22data%22%3A%7B%22itemType%22%3A%22journalArticle%22%2C%22title%22%3A%22Influence%20of%20past%20and%20future%20climate%20changes%20on%20the%20distribution%20of%20three%20Southeast%20Asian%20murine%20rodents%22%2C%22creators%22%3A%5B%7B%22creatorType%22%3A%22author%22%2C%22firstName%22%3A%22Alice%22%2C%22lastName%22%3A%22Latinne%22%7D%2C%7B%22creatorType%22%3A%22author%22%2C%22firstName%22%3A%22Christine%20N.%22%2C%22lastName%22%3A%22Meynard%22%7D%2C%7B%22creatorType%22%3A%22author%22%2C%22firstName%22%3A%22Vincent%22%2C%22lastName%22%3A%22Herbreteau%22%7D%2C%7B%22creatorType%22%3A%22author%22%2C%22firstName%22%3A%22Surachit%22%2C%22lastName%22%3A%22Waengsothorn%22%7D%2C%7B%22creatorType%22%3A%22author%22%2C%22firstName%22%3A%22Serge%22%2C%22lastName%22%3A%22Morand%22%7D%2C%7B%22creatorType%22%3A%22author%22%2C%22firstName%22%3A%22Johan%20R.%22%2C%22lastName%22%3A%22Michaux%22%7D%5D%2C%22abstractNote%22%3A%22Aim%20We%20tested%20the%20influence%20of%20Pleistocene%20climatic%20fluctuations%20and%20the%20potential%20effect%20of%20future%20climate%20change%20on%20Southeast%20Asian%20small%20mammal%20distributions%20using%20two%20forest-dwelling%20%28Leopoldamys%20herberti%20and%20Leopoldamys%20sabanus%29%20and%20one%20karst%20%28Leopoldamys%20neilli%29%20endemic%20rodent%20species%20as%20models.%20Location%20Southeast%20Asia.%20Methods%20We%20used%20presence%5Cu2013absence%20data%20of%20genetically%20identified%20individuals%2C%20bioclimatic%20variables%20and%20species%20distribution%20modelling%20techniques%20to%20predict%20potential%20distributions%20of%20the%20three%20studied%20species%20under%20current%2C%20past%20%5BLast%20Interglacial%20%28LIG%29%20and%20Last%20Glacial%20Maximum%20%28LGM%29%5D%20and%20future%20conditions.%20We%20applied%20a%20variety%20of%20modelling%20techniques%20and%20then%20used%20consensus%20techniques%20to%20draw%20up%20robust%20maps%20of%20potential%20distribution%20ranges%20at%20all%20stages.%20Results%20According%20to%20our%20models%2C%20these%20three%20Leopoldamys%20species%20did%20not%20experience%20significant%20range%20contraction%20during%20the%20LGM.%20Our%20models%20revealed%20substantial%20range%20contraction%20during%20the%20LIG%20for%20L.%20herberti%20in%20northern%20Indochina%2C%20while%20its%20distribution%20expanded%20in%20southern%20Indochina.%20Evidence%20of%20a%20southward%20range%20expansion%20during%20that%20period%20was%20also%20obtained%20for%20L.%20neilli%2C%20whereas%20L.%20sabanus%20remained%20widely%20distributed%20in%20insular%20Southeast%20Asia%20but%20experienced%20a%20range%20contraction%20on%20the%20Thai-Malay%20Peninsula.%20The%20two%20future%20climate%20change%20scenarios%20used%20predicted%20that%20large%20climatically%20suitable%20areas%20would%20still%20be%20available%20in%20the%20future%20for%20the%20three%20species.%20Main%20conclusions%20Our%20model%20predictions%20contradict%20the%20well-established%20hypothesis%20that%20Southeast%20Asian%20forest-dwelling%20species%20were%20confined%20to%20small%20refugia%20during%20the%20LGM.%20Moreover%2C%20our%20results%20suggest%20that%20some%20Southeast%20Asian%20taxa%20may%20have%20been%20distributed%20in%20their%20refugial%20state%20during%20the%20LIG%20rather%20than%20the%20LGM.%20This%20could%20be%20because%20of%20vegetation%20changes%20that%20may%20have%20occurred%20at%20that%20time%20as%20a%20result%20of%20the%20increased%20seasonality%20observed%20during%20the%20LIG.%20These%20Pleistocene%20refugia%20may%20have%20been%20localized%20in%20northern%20Indochina%20but%20our%20study%20also%20revealed%20that%20southern%20Indochina%20could%20provide%20major%20potential%20refugia.%22%2C%22date%22%3A%222015%22%2C%22section%22%3A%22%22%2C%22partNumber%22%3A%22%22%2C%22partTitle%22%3A%22%22%2C%22DOI%22%3A%2210.1111%5C%2Fjbi.12528%22%2C%22citationKey%22%3A%22%22%2C%22url%22%3A%22http%3A%5C%2F%5C%2Fdx.doi.org%5C%2F10.1111%5C%2Fjbi.12528%20http%3A%5C%2F%5C%2Fonlinelibrary.wiley.com%5C%2Fstore%5C%2F10.1111%5C%2Fjbi.12528%5C%2Fasset%5C%2Fjbi12528.pdf%3Fv%3D1%26t%3Dimq0c6r7%26s%3D5728e011bde4fe0e243c49fdaba2a632ccbc8d43%22%2C%22PMID%22%3A%22%22%2C%22PMCID%22%3A%22%22%2C%22ISSN%22%3A%2203050270%22%2C%22language%22%3A%22%22%2C%22collections%22%3A%5B%5D%2C%22dateModified%22%3A%222022-10-03T02%3A03%3A59Z%22%7D%7D%2C%7B%22key%22%3A%22LE2UV6ZT%22%2C%22library%22%3A%7B%22id%22%3A4800755%7D%2C%22meta%22%3A%7B%22creatorSummary%22%3A%22Morand%20et%20al.%22%2C%22parsedDate%22%3A%222015%22%2C%22numChildren%22%3A0%7D%2C%22bib%22%3A%22%26lt%3Bdiv%20class%3D%26quot%3Bcsl-bib-body%26quot%3B%20style%3D%26quot%3Bline-height%3A%202%3B%20padding-left%3A%201em%3B%20text-indent%3A-1em%3B%26quot%3B%26gt%3B%5Cn%20%20%26lt%3Bdiv%20class%3D%26quot%3Bcsl-entry%26quot%3B%26gt%3BMorand%2C%20S.%2C%20Bordes%2C%20F.%2C%20Blasdell%2C%20K.%2C%20Pilosof%2C%20S.%2C%20Cornu%2C%20J.-F.%2C%20Chaisiri%2C%20K.%2C%20Chaval%2C%20Y.%2C%20Cosson%2C%20J.-F.%2C%20Claude%2C%20J.%2C%20Feyfant%2C%20T.%2C%20Herbreteau%2C%20V.%2C%20Dupuy%2C%20S.%2C%20%26amp%3B%20Tran%2C%20A.%20%282015%29.%20Assessing%20the%20distribution%20of%20disease-bearing%20rodents%20in%20human-modified%20tropical%20landscapes.%20%26lt%3Bi%26gt%3BJournal%20of%20Applied%20Ecology%26lt%3B%5C%2Fi%26gt%3B%2C%20%26lt%3Bi%26gt%3B52%26lt%3B%5C%2Fi%26gt%3B%283%29%2C%20784%26%23x2013%3B794.%20%26lt%3Ba%20class%3D%26%23039%3Bzp-DOIURL%26%23039%3B%20target%3D%26%23039%3B_blank%26%23039%3B%20href%3D%26%23039%3Bhttps%3A%5C%2F%5C%2Fdoi.org%5C%2F10.1111%5C%2F1365-2664.12414%26%23039%3B%26gt%3Bhttps%3A%5C%2F%5C%2Fdoi.org%5C%2F10.1111%5C%2F1365-2664.12414%26lt%3B%5C%2Fa%26gt%3B%20%26lt%3Ba%20title%3D%26%23039%3BCite%20in%20RIS%20Format%26%23039%3B%20class%3D%26%23039%3Bzp-CiteRIS%26%23039%3B%20data-zp-cite%3D%26%23039%3Bapi_user_id%3D4800755%26amp%3Bitem_key%3DLE2UV6ZT%26%23039%3B%20href%3D%26%23039%3Bjavascript%3Avoid%280%29%3B%26%23039%3B%26gt%3BCite%26lt%3B%5C%2Fa%26gt%3B%20%26lt%3B%5C%2Fdiv%26gt%3B%5Cn%26lt%3B%5C%2Fdiv%26gt%3B%22%2C%22data%22%3A%7B%22itemType%22%3A%22journalArticle%22%2C%22title%22%3A%22Assessing%20the%20distribution%20of%20disease-bearing%20rodents%20in%20human-modified%20tropical%20landscapes%22%2C%22creators%22%3A%5B%7B%22creatorType%22%3A%22author%22%2C%22firstName%22%3A%22Serge%22%2C%22lastName%22%3A%22Morand%22%7D%2C%7B%22creatorType%22%3A%22author%22%2C%22firstName%22%3A%22Fr%5Cu00e9d%5Cu00e9ric%22%2C%22lastName%22%3A%22Bordes%22%7D%2C%7B%22creatorType%22%3A%22author%22%2C%22firstName%22%3A%22Kim%22%2C%22lastName%22%3A%22Blasdell%22%7D%2C%7B%22creatorType%22%3A%22author%22%2C%22firstName%22%3A%22Shai%22%2C%22lastName%22%3A%22Pilosof%22%7D%2C%7B%22creatorType%22%3A%22author%22%2C%22firstName%22%3A%22Jean-Fran%5Cu00e7ois%22%2C%22lastName%22%3A%22Cornu%22%7D%2C%7B%22creatorType%22%3A%22author%22%2C%22firstName%22%3A%22Kittipong%22%2C%22lastName%22%3A%22Chaisiri%22%7D%2C%7B%22creatorType%22%3A%22author%22%2C%22firstName%22%3A%22Yannick%22%2C%22lastName%22%3A%22Chaval%22%7D%2C%7B%22creatorType%22%3A%22author%22%2C%22firstName%22%3A%22Jean-Fran%5Cu00e7ois%22%2C%22lastName%22%3A%22Cosson%22%7D%2C%7B%22creatorType%22%3A%22author%22%2C%22firstName%22%3A%22Julien%22%2C%22lastName%22%3A%22Claude%22%7D%2C%7B%22creatorType%22%3A%22author%22%2C%22firstName%22%3A%22Tristan%22%2C%22lastName%22%3A%22Feyfant%22%7D%2C%7B%22creatorType%22%3A%22author%22%2C%22firstName%22%3A%22Vincent%22%2C%22lastName%22%3A%22Herbreteau%22%7D%2C%7B%22creatorType%22%3A%22author%22%2C%22firstName%22%3A%22St%5Cu00e9phane%22%2C%22lastName%22%3A%22Dupuy%22%7D%2C%7B%22creatorType%22%3A%22author%22%2C%22firstName%22%3A%22Annelise%22%2C%22lastName%22%3A%22Tran%22%7D%5D%2C%22abstractNote%22%3A%22%22%2C%22date%22%3A%222015%22%2C%22section%22%3A%22%22%2C%22partNumber%22%3A%22%22%2C%22partTitle%22%3A%22%22%2C%22DOI%22%3A%2210.1111%5C%2F1365-2664.12414%22%2C%22citationKey%22%3A%22%22%2C%22url%22%3A%22http%3A%5C%2F%5C%2Fdx.doi.org%5C%2F10.1111%5C%2F1365-2664.12414%20http%3A%5C%2F%5C%2Fonlinelibrary.wiley.com%5C%2Fstore%5C%2F10.1111%5C%2F1365-2664.12414%5C%2Fasset%5C%2Fjpe12414.pdf%3Fv%3D1%26t%3Di88zrbyw%26s%3Db39e2abe82a558aa1c58f219ae355fc6cce9cb76%22%2C%22PMID%22%3A%22%22%2C%22PMCID%22%3A%22%22%2C%22ISSN%22%3A%221365-2664%22%2C%22language%22%3A%22%22%2C%22collections%22%3A%5B%5D%2C%22dateModified%22%3A%222022-10-03T02%3A03%3A59Z%22%7D%7D%2C%7B%22key%22%3A%22THIR53FJ%22%2C%22library%22%3A%7B%22id%22%3A4800755%7D%2C%22meta%22%3A%7B%22creatorSummary%22%3A%22R%5Cu00e9villion%20et%20al.%22%2C%22parsedDate%22%3A%222015%22%2C%22numChildren%22%3A0%7D%2C%22bib%22%3A%22%26lt%3Bdiv%20class%3D%26quot%3Bcsl-bib-body%26quot%3B%20style%3D%26quot%3Bline-height%3A%202%3B%20padding-left%3A%201em%3B%20text-indent%3A-1em%3B%26quot%3B%26gt%3B%5Cn%20%20%26lt%3Bdiv%20class%3D%26quot%3Bcsl-entry%26quot%3B%26gt%3BR%26%23xE9%3Bvillion%2C%20C.%2C%20Lagadec%2C%20E.%2C%20Le%20Minter%2C%20G.%2C%20Dessay%2C%20N.%2C%20Guernier%2C%20V.%2C%20Sand%2C%20A.%2C%20Tortosa%2C%20P.%2C%20Dellagi%2C%20K.%2C%20%26amp%3B%20Herbreteau%2C%20V.%20%282015%29.%20Utilisation%20de%20la%20tr%26%23xE8%3Bs%20haute%20r%26%23xE9%3Bsolution%20spatiale%20pour%20la%20caract%26%23xE9%3Brisation%20des%20habitats%20de%20rongeurs%2C%20vecteurs%20de%20zoonoses%20%26%23xE0%3B%20la%20R%26%23xE9%3Bunion.%20%26lt%3Bi%26gt%3BRevue%20Fran%26%23xE7%3Baise%20de%20Photogramm%26%23xE9%3Btrie%20et%20de%20T%26%23xE9%3Bl%26%23xE9%3Bd%26%23xE9%3Btection%26lt%3B%5C%2Fi%26gt%3B%2C%20%26lt%3Bi%26gt%3B209%26lt%3B%5C%2Fi%26gt%3B%2C%2065%26%23x2013%3B71.%20%26lt%3Ba%20title%3D%26%23039%3BCite%20in%20RIS%20Format%26%23039%3B%20class%3D%26%23039%3Bzp-CiteRIS%26%23039%3B%20data-zp-cite%3D%26%23039%3Bapi_user_id%3D4800755%26amp%3Bitem_key%3DTHIR53FJ%26%23039%3B%20href%3D%26%23039%3Bjavascript%3Avoid%280%29%3B%26%23039%3B%26gt%3BCite%26lt%3B%5C%2Fa%26gt%3B%20%26lt%3B%5C%2Fdiv%26gt%3B%5Cn%26lt%3B%5C%2Fdiv%26gt%3B%22%2C%22data%22%3A%7B%22itemType%22%3A%22journalArticle%22%2C%22title%22%3A%22Utilisation%20de%20la%20tr%5Cu00e8s%20haute%20r%5Cu00e9solution%20spatiale%20pour%20la%20caract%5Cu00e9risation%20des%20habitats%20de%20rongeurs%2C%20vecteurs%20de%20zoonoses%20%5Cu00e0%20la%20R%5Cu00e9union%22%2C%22creators%22%3A%5B%7B%22creatorType%22%3A%22author%22%2C%22firstName%22%3A%22Christophe%22%2C%22lastName%22%3A%22R%5Cu00e9villion%22%7D%2C%7B%22creatorType%22%3A%22author%22%2C%22firstName%22%3A%22Erwan%22%2C%22lastName%22%3A%22Lagadec%22%7D%2C%7B%22creatorType%22%3A%22author%22%2C%22firstName%22%3A%22Gildas%22%2C%22lastName%22%3A%22Le%20Minter%22%7D%2C%7B%22creatorType%22%3A%22author%22%2C%22firstName%22%3A%22Nadine%22%2C%22lastName%22%3A%22Dessay%22%7D%2C%7B%22creatorType%22%3A%22author%22%2C%22firstName%22%3A%22Vanina%22%2C%22lastName%22%3A%22Guernier%22%7D%2C%7B%22creatorType%22%3A%22author%22%2C%22firstName%22%3A%22Aur%5Cu00e9lie%22%2C%22lastName%22%3A%22Sand%22%7D%2C%7B%22creatorType%22%3A%22author%22%2C%22firstName%22%3A%22Pablo%22%2C%22lastName%22%3A%22Tortosa%22%7D%2C%7B%22creatorType%22%3A%22author%22%2C%22firstName%22%3A%22Koussay%22%2C%22lastName%22%3A%22Dellagi%22%7D%2C%7B%22creatorType%22%3A%22author%22%2C%22firstName%22%3A%22Vincent%22%2C%22lastName%22%3A%22Herbreteau%22%7D%5D%2C%22abstractNote%22%3A%22%22%2C%22date%22%3A%222015%22%2C%22section%22%3A%22%22%2C%22partNumber%22%3A%22%22%2C%22partTitle%22%3A%22%22%2C%22DOI%22%3A%22%22%2C%22citationKey%22%3A%22%22%2C%22url%22%3A%22%22%2C%22PMID%22%3A%22%22%2C%22PMCID%22%3A%22%22%2C%22ISSN%22%3A%22%22%2C%22language%22%3A%22%22%2C%22collections%22%3A%5B%5D%2C%22dateModified%22%3A%222022-10-03T02%3A03%3A59Z%22%7D%7D%2C%7B%22key%22%3A%228W6A3QG5%22%2C%22library%22%3A%7B%22id%22%3A4800755%7D%2C%22meta%22%3A%7B%22creatorSummary%22%3A%22Pakdeenarong%20et%20al.%22%2C%22parsedDate%22%3A%222014-09%22%2C%22numChildren%22%3A1%7D%2C%22bib%22%3A%22%26lt%3Bdiv%20class%3D%26quot%3Bcsl-bib-body%26quot%3B%20style%3D%26quot%3Bline-height%3A%202%3B%20padding-left%3A%201em%3B%20text-indent%3A-1em%3B%26quot%3B%26gt%3B%5Cn%20%20%26lt%3Bdiv%20class%3D%26quot%3Bcsl-entry%26quot%3B%26gt%3BPakdeenarong%2C%20N.%2C%20Siribat%2C%20P.%2C%20Chaisiri%2C%20K.%2C%20Douangboupha%2C%20B.%2C%20Ribas%2C%20A.%2C%20Chaval%2C%20Y.%2C%20Herbreteau%2C%20V.%2C%20%26amp%3B%20Morand%2C%20S.%20%282014%29.%20Helminth%20communities%20in%20murid%20rodents%20from%20southern%20and%20northern%20localities%20in%20Lao%20PDR%3A%20the%20role%20of%20habitat%20and%20season.%20%26lt%3Bi%26gt%3BJ%20Helminthol%26lt%3B%5C%2Fi%26gt%3B%2C%20%26lt%3Bi%26gt%3B88%26lt%3B%5C%2Fi%26gt%3B%283%29%2C%20302%26%23x2013%3B309.%20%26lt%3Ba%20class%3D%26%23039%3Bzp-DOIURL%26%23039%3B%20target%3D%26%23039%3B_blank%26%23039%3B%20href%3D%26%23039%3Bhttps%3A%5C%2F%5C%2Fdoi.org%5C%2F10.1017%5C%2FS0022149X13000187%26%23039%3B%26gt%3Bhttps%3A%5C%2F%5C%2Fdoi.org%5C%2F10.1017%5C%2FS0022149X13000187%26lt%3B%5C%2Fa%26gt%3B%20%26lt%3Ba%20title%3D%26%23039%3BCite%20in%20RIS%20Format%26%23039%3B%20class%3D%26%23039%3Bzp-CiteRIS%26%23039%3B%20data-zp-cite%3D%26%23039%3Bapi_user_id%3D4800755%26amp%3Bitem_key%3D8W6A3QG5%26%23039%3B%20href%3D%26%23039%3Bjavascript%3Avoid%280%29%3B%26%23039%3B%26gt%3BCite%26lt%3B%5C%2Fa%26gt%3B%20%26lt%3B%5C%2Fdiv%26gt%3B%5Cn%26lt%3B%5C%2Fdiv%26gt%3B%22%2C%22data%22%3A%7B%22itemType%22%3A%22journalArticle%22%2C%22title%22%3A%22Helminth%20communities%20in%20murid%20rodents%20from%20southern%20and%20northern%20localities%20in%20Lao%20PDR%3A%20the%20role%20of%20habitat%20and%20season%22%2C%22creators%22%3A%5B%7B%22creatorType%22%3A%22author%22%2C%22firstName%22%3A%22N.%22%2C%22lastName%22%3A%22Pakdeenarong%22%7D%2C%7B%22creatorType%22%3A%22author%22%2C%22firstName%22%3A%22P.%22%2C%22lastName%22%3A%22Siribat%22%7D%2C%7B%22creatorType%22%3A%22author%22%2C%22firstName%22%3A%22K.%22%2C%22lastName%22%3A%22Chaisiri%22%7D%2C%7B%22creatorType%22%3A%22author%22%2C%22firstName%22%3A%22B.%22%2C%22lastName%22%3A%22Douangboupha%22%7D%2C%7B%22creatorType%22%3A%22author%22%2C%22firstName%22%3A%22A.%22%2C%22lastName%22%3A%22Ribas%22%7D%2C%7B%22creatorType%22%3A%22author%22%2C%22firstName%22%3A%22Y.%22%2C%22lastName%22%3A%22Chaval%22%7D%2C%7B%22creatorType%22%3A%22author%22%2C%22firstName%22%3A%22V.%22%2C%22lastName%22%3A%22Herbreteau%22%7D%2C%7B%22creatorType%22%3A%22author%22%2C%22firstName%22%3A%22S.%22%2C%22lastName%22%3A%22Morand%22%7D%5D%2C%22abstractNote%22%3A%22The%20helminth%20communities%20of%20wild%20murid%20rodents%20were%20investigated%20in%20Luang%20Prabang%20and%20Champasak%20province%2C%20Lao%20PDR.%20Thirteen%20species%20of%20rodents%20%28404%20individuals%29%20were%20infected%20by%2019%20species%20of%20parasites%20%282%20trematode%2C%203%20cestode%2C%2014%20nematode%20species%29.%20Four%20of%20the%20recorded%20helminth%20species%20%28Echinostoma%20malayanum%2C%20Raillietina%20sp.%2C%20Hymenolepis%20diminuta%20and%20H.%20nana%29%20are%20known%20to%20cause%20potential%20zoonotic%20helminthiases%20of%20medical%20importance%20in%20the%20South-East%20Asian%20region.%20Individual%20helminth%20infection%20was%20significantly%20higher%20in%20the%20wet%20season.%20Habitat%20significantly%20influenced%20individual%20helminth%20species%20richness%20and%20individual%20helminth%20abudance%2C%20with%20a%20decrease%20of%20individual%20helminth%20species%20richness%20and%20individual%20helminth%20abundance%20from%20forest%20habitat%20to%20agricultural%20and%20human%20settlement%20habitats.%20The%20reduction%20of%20helminth%20diversity%20and%20abundance%20is%20discussed%20in%20relation%20to%20the%20ongoing%20increase%20of%20human%20influence%20on%20habitats%20in%20Lao%20PDR.%22%2C%22date%22%3A%222014%20Sep%22%2C%22section%22%3A%22%22%2C%22partNumber%22%3A%22%22%2C%22partTitle%22%3A%22%22%2C%22DOI%22%3A%2210.1017%5C%2FS0022149X13000187%22%2C%22citationKey%22%3A%22%22%2C%22url%22%3A%22http%3A%5C%2F%5C%2Fwww.ncbi.nlm.nih.gov%5C%2Fpubmed%5C%2F23552185%22%2C%22PMID%22%3A%22%22%2C%22PMCID%22%3A%22%22%2C%22ISSN%22%3A%221475-2697%20%28Electronic%29%200022-149X%20%28Linking%29%22%2C%22language%22%3A%22%22%2C%22collections%22%3A%5B%5D%2C%22dateModified%22%3A%222022-10-03T02%3A03%3A59Z%22%7D%7D%2C%7B%22key%22%3A%22NJDD9GVY%22%2C%22library%22%3A%7B%22id%22%3A4800755%7D%2C%22meta%22%3A%7B%22creatorSummary%22%3A%22Cosson%20et%20al.%22%2C%22parsedDate%22%3A%222014-06%22%2C%22numChildren%22%3A1%7D%2C%22bib%22%3A%22%26lt%3Bdiv%20class%3D%26quot%3Bcsl-bib-body%26quot%3B%20style%3D%26quot%3Bline-height%3A%202%3B%20padding-left%3A%201em%3B%20text-indent%3A-1em%3B%26quot%3B%26gt%3B%5Cn%20%20%26lt%3Bdiv%20class%3D%26quot%3Bcsl-entry%26quot%3B%26gt%3BCosson%2C%20J.%20F.%2C%20Picardeau%2C%20M.%2C%20Mielcarek%2C%20M.%2C%20Tatard%2C%20C.%2C%20Chaval%2C%20Y.%2C%20Suputtamongkol%2C%20Y.%2C%20Buchy%2C%20P.%2C%20Jittapalapong%2C%20S.%2C%20Herbreteau%2C%20V.%2C%20%26amp%3B%20Morand%2C%20S.%20%282014%29.%20Epidemiology%20of%20Leptospira%20transmitted%20by%20rodents%20in%20Southeast%20Asia.%20%26lt%3Bi%26gt%3BPLoS%20Negl%20Trop%20Dis%26lt%3B%5C%2Fi%26gt%3B%2C%20%26lt%3Bi%26gt%3B8%26lt%3B%5C%2Fi%26gt%3B%286%29%2C%20e2902.%20%26lt%3Ba%20class%3D%26%23039%3Bzp-DOIURL%26%23039%3B%20target%3D%26%23039%3B_blank%26%23039%3B%20href%3D%26%23039%3Bhttps%3A%5C%2F%5C%2Fdoi.org%5C%2F10.1371%5C%2Fjournal.pntd.0002902%26%23039%3B%26gt%3Bhttps%3A%5C%2F%5C%2Fdoi.org%5C%2F10.1371%5C%2Fjournal.pntd.0002902%26lt%3B%5C%2Fa%26gt%3B%20%26lt%3Ba%20title%3D%26%23039%3BCite%20in%20RIS%20Format%26%23039%3B%20class%3D%26%23039%3Bzp-CiteRIS%26%23039%3B%20data-zp-cite%3D%26%23039%3Bapi_user_id%3D4800755%26amp%3Bitem_key%3DNJDD9GVY%26%23039%3B%20href%3D%26%23039%3Bjavascript%3Avoid%280%29%3B%26%23039%3B%26gt%3BCite%26lt%3B%5C%2Fa%26gt%3B%20%26lt%3B%5C%2Fdiv%26gt%3B%5Cn%26lt%3B%5C%2Fdiv%26gt%3B%22%2C%22data%22%3A%7B%22itemType%22%3A%22journalArticle%22%2C%22title%22%3A%22Epidemiology%20of%20Leptospira%20transmitted%20by%20rodents%20in%20Southeast%20Asia%22%2C%22creators%22%3A%5B%7B%22creatorType%22%3A%22author%22%2C%22firstName%22%3A%22J.%20F.%22%2C%22lastName%22%3A%22Cosson%22%7D%2C%7B%22creatorType%22%3A%22author%22%2C%22firstName%22%3A%22M.%22%2C%22lastName%22%3A%22Picardeau%22%7D%2C%7B%22creatorType%22%3A%22author%22%2C%22firstName%22%3A%22M.%22%2C%22lastName%22%3A%22Mielcarek%22%7D%2C%7B%22creatorType%22%3A%22author%22%2C%22firstName%22%3A%22C.%22%2C%22lastName%22%3A%22Tatard%22%7D%2C%7B%22creatorType%22%3A%22author%22%2C%22firstName%22%3A%22Y.%22%2C%22lastName%22%3A%22Chaval%22%7D%2C%7B%22creatorType%22%3A%22author%22%2C%22firstName%22%3A%22Y.%22%2C%22lastName%22%3A%22Suputtamongkol%22%7D%2C%7B%22creatorType%22%3A%22author%22%2C%22firstName%22%3A%22P.%22%2C%22lastName%22%3A%22Buchy%22%7D%2C%7B%22creatorType%22%3A%22author%22%2C%22firstName%22%3A%22S.%22%2C%22lastName%22%3A%22Jittapalapong%22%7D%2C%7B%22creatorType%22%3A%22author%22%2C%22firstName%22%3A%22V.%22%2C%22lastName%22%3A%22Herbreteau%22%7D%2C%7B%22creatorType%22%3A%22author%22%2C%22firstName%22%3A%22S.%22%2C%22lastName%22%3A%22Morand%22%7D%5D%2C%22abstractNote%22%3A%22BACKGROUND%3A%20Leptospirosis%20is%20the%20most%20common%20bacterial%20zoonoses%20and%20has%20been%20identified%20as%20an%20important%20emerging%20global%20public%20health%20problem%20in%20Southeast%20Asia.%20Rodents%20are%20important%20reservoirs%20for%20human%20leptospirosis%2C%20but%20epidemiological%20data%20is%20lacking.%20METHODOLOGY%5C%2FPRINCIPAL%20FINDINGS%3A%20We%20sampled%20rodents%20living%20in%20different%20habitats%20from%20seven%20localities%20distributed%20across%20Southeast%20Asia%20%28Thailand%2C%20Lao%20PDR%20and%20Cambodia%29%2C%20between%202009%20to%202010.%20Human%20isolates%20were%20also%20obtained%20from%20localities%20close%20to%20where%20rodents%20were%20sampled.%20The%20prevalence%20of%20Leptospira%20infection%20was%20assessed%20by%20real-time%20PCR%20using%20DNA%20extracted%20from%20rodent%20kidneys%2C%20targeting%20the%20lipL32%20gene.%20Sequencing%20rrs%20and%20secY%20genes%2C%20and%20Multi%20Locus%20Variable-number%20Tandem%20Repeat%20%28VNTR%29%20analyses%20were%20performed%20on%20DNA%20extracted%20from%20rat%20kidneys%20for%20Leptospira%20isolates%20molecular%20typing.%20Four%20species%20were%20detected%20in%20rodents%2C%20L.%20borgpetersenii%20%2856%25%20of%20positive%20samples%29%2C%20L.%20interrogans%20%2836%25%29%2C%20L.%20kirschneri%20%283%25%29%20and%20L.%20weilli%20%282%25%29%2C%20which%20were%20identical%20to%20human%20isolates.%20Mean%20prevalence%20in%20rodents%20was%20approximately%207%25%2C%20and%20largely%20varied%20across%20localities%20and%20habitats%2C%20but%20not%20between%20rodent%20species.%20The%20two%20most%20abundant%20Leptospira%20species%20displayed%20different%20habitat%20requirements%3A%20L.%20interrogans%20was%20linked%20to%20humid%20habitats%20%28rice%20fields%20and%20forests%29%20while%20L.%20borgpetersenii%20was%20abundant%20in%20both%20humid%20and%20dry%20habitats%20%28non-floodable%20lands%29.%20CONCLUSION%5C%2FSIGNIFICANCE%3A%20L.%20interrogans%20and%20L.%20borgpetersenii%20species%20are%20widely%20distributed%20amongst%20rodent%20populations%2C%20and%20strain%20typing%20confirmed%20rodents%20as%20reservoirs%20for%20human%20leptospirosis.%20Differences%20in%20habitat%20requirements%20for%20L.%20interrogans%20and%20L.%20borgpetersenii%20supported%20differential%20transmission%20modes.%20In%20Southeast%20Asia%2C%20human%20infection%20risk%20is%20not%20only%20restricted%20to%20activities%20taking%20place%20in%20wetlands%20and%20rice%20fields%20as%20is%20commonly%20accepted%2C%20but%20should%20also%20include%20tasks%20such%20as%20forestry%20work%2C%20as%20well%20as%20the%20hunting%20and%20preparation%20of%20rodents%20for%20consumption%2C%20which%20deserve%20more%20attention%20in%20future%20epidemiological%20studies.%22%2C%22date%22%3A%222014%20Jun%22%2C%22section%22%3A%22%22%2C%22partNumber%22%3A%22%22%2C%22partTitle%22%3A%22%22%2C%22DOI%22%3A%2210.1371%5C%2Fjournal.pntd.0002902%22%2C%22citationKey%22%3A%22%22%2C%22url%22%3A%22http%3A%5C%2F%5C%2Fwww.ncbi.nlm.nih.gov%5C%2Fpubmed%5C%2F24901706%22%2C%22PMID%22%3A%22%22%2C%22PMCID%22%3A%22%22%2C%22ISSN%22%3A%221935-2735%20%28Electronic%29%201935-2727%20%28Linking%29%22%2C%22language%22%3A%22%22%2C%22collections%22%3A%5B%5D%2C%22dateModified%22%3A%222022-10-03T02%3A03%3A59Z%22%7D%7D%2C%7B%22key%22%3A%2258ALPT53%22%2C%22library%22%3A%7B%22id%22%3A4800755%7D%2C%22meta%22%3A%7B%22creatorSummary%22%3A%22Kesteman%20et%20al.%22%2C%22parsedDate%22%3A%222014%22%2C%22numChildren%22%3A1%7D%2C%22bib%22%3A%22%26lt%3Bdiv%20class%3D%26quot%3Bcsl-bib-body%26quot%3B%20style%3D%26quot%3Bline-height%3A%202%3B%20padding-left%3A%201em%3B%20text-indent%3A-1em%3B%26quot%3B%26gt%3B%5Cn%20%20%26lt%3Bdiv%20class%3D%26quot%3Bcsl-entry%26quot%3B%26gt%3BKesteman%2C%20T.%2C%20Randrianarivelojosia%2C%20M.%2C%20Mattern%2C%20C.%2C%20Raboanary%2C%20E.%2C%20Pourette%2C%20D.%2C%20Girond%2C%20F.%2C%20Raharimanga%2C%20V.%2C%20Randrianasolo%2C%20L.%2C%20Piola%2C%20P.%2C%20%26amp%3B%20Rogier%2C%20C.%20%282014%29.%20Nationwide%20evaluation%20of%20malaria%20infections%2C%20morbidity%2C%20mortality%2C%20and%20coverage%20of%20malaria%20control%20interventions%20in%20Madagascar.%20%26lt%3Bi%26gt%3BMalar%20J%26lt%3B%5C%2Fi%26gt%3B%2C%20%26lt%3Bi%26gt%3B13%26lt%3B%5C%2Fi%26gt%3B%2C%20465.%20%26lt%3Ba%20class%3D%26%23039%3Bzp-DOIURL%26%23039%3B%20target%3D%26%23039%3B_blank%26%23039%3B%20href%3D%26%23039%3Bhttps%3A%5C%2F%5C%2Fdoi.org%5C%2F10.1186%5C%2F1475-2875-13-465%26%23039%3B%26gt%3Bhttps%3A%5C%2F%5C%2Fdoi.org%5C%2F10.1186%5C%2F1475-2875-13-465%26lt%3B%5C%2Fa%26gt%3B%20%26lt%3Ba%20title%3D%26%23039%3BCite%20in%20RIS%20Format%26%23039%3B%20class%3D%26%23039%3Bzp-CiteRIS%26%23039%3B%20data-zp-cite%3D%26%23039%3Bapi_user_id%3D4800755%26amp%3Bitem_key%3D58ALPT53%26%23039%3B%20href%3D%26%23039%3Bjavascript%3Avoid%280%29%3B%26%23039%3B%26gt%3BCite%26lt%3B%5C%2Fa%26gt%3B%20%26lt%3B%5C%2Fdiv%26gt%3B%5Cn%26lt%3B%5C%2Fdiv%26gt%3B%22%2C%22data%22%3A%7B%22itemType%22%3A%22journalArticle%22%2C%22title%22%3A%22Nationwide%20evaluation%20of%20malaria%20infections%2C%20morbidity%2C%20mortality%2C%20and%20coverage%20of%20malaria%20control%20interventions%20in%20Madagascar%22%2C%22creators%22%3A%5B%7B%22creatorType%22%3A%22author%22%2C%22firstName%22%3A%22T.%22%2C%22lastName%22%3A%22Kesteman%22%7D%2C%7B%22creatorType%22%3A%22author%22%2C%22firstName%22%3A%22M.%22%2C%22lastName%22%3A%22Randrianarivelojosia%22%7D%2C%7B%22creatorType%22%3A%22author%22%2C%22firstName%22%3A%22C.%22%2C%22lastName%22%3A%22Mattern%22%7D%2C%7B%22creatorType%22%3A%22author%22%2C%22firstName%22%3A%22E.%22%2C%22lastName%22%3A%22Raboanary%22%7D%2C%7B%22creatorType%22%3A%22author%22%2C%22firstName%22%3A%22D.%22%2C%22lastName%22%3A%22Pourette%22%7D%2C%7B%22creatorType%22%3A%22author%22%2C%22firstName%22%3A%22F.%22%2C%22lastName%22%3A%22Girond%22%7D%2C%7B%22creatorType%22%3A%22author%22%2C%22firstName%22%3A%22V.%22%2C%22lastName%22%3A%22Raharimanga%22%7D%2C%7B%22creatorType%22%3A%22author%22%2C%22firstName%22%3A%22L.%22%2C%22lastName%22%3A%22Randrianasolo%22%7D%2C%7B%22creatorType%22%3A%22author%22%2C%22firstName%22%3A%22P.%22%2C%22lastName%22%3A%22Piola%22%7D%2C%7B%22creatorType%22%3A%22author%22%2C%22firstName%22%3A%22C.%22%2C%22lastName%22%3A%22Rogier%22%7D%5D%2C%22abstractNote%22%3A%22BACKGROUND%3A%20In%20the%20last%20decade%2C%20an%20important%20scale-up%20was%20observed%20in%20malaria%20control%20interventions.%20Madagascar%20entered%20the%20process%20for%20pre-elimination%20in%202007.%20Policy%20making%20needs%20operational%20indicators%2C%20but%20also%20indicators%20about%20effectiveness%20and%20impact%20of%20malaria%20control%20interventions%20%28MCI%29.%20This%20study%20is%20aimed%20at%20providing%20data%20about%20malaria%20infection%2C%20morbidity%2C%20and%20mortality%2C%20and%20MCI%20in%20Madagascar.%20METHODS%3A%20Two%20nationwide%20surveys%20were%20simultaneously%20conducted%20in%202012-2013%20in%20Madagascar%3A%20a%20study%20about%20non-complicated%20clinical%20malaria%20cases%20in%2031%20sentinel%20health%20facilities%2C%20and%20a%20cross-sectional%20survey%20%28CSS%29%20in%2062%20sites.%20The%20CSS%20encompassed%20interviews%2C%20collection%20of%20biological%20samples%20and%20verbal%20autopsies%20%28VA%29.%20Data%20from%20CSS%20were%20weighted%20for%20age%2C%20sex%2C%20malaria%20transmission%20pattern%2C%20and%20population%20density.%20VA%20data%20were%20processed%20with%20InterVA-4%20software.%20RESULTS%3A%20CSS%20included%2015%2C746%20individuals%20of%20all%20ages.%20Parasite%20rate%20%28PR%29%20as%20measured%20by%20rapid%20diagnostic%20tests%20was%203.1%25%2C%20and%20was%20significantly%20higher%20in%20five%20to%2019%20year%20olds%2C%20in%20males%2C%20poorer%20socio-economic%20status%20%28SES%29%20quintiles%20and%20rural%20areas.%20Long-lasting%20insecticidal%20nets%20%28LLIN%29%20use%20was%2041.7%25%20and%20was%20significantly%20lower%20in%20five%20to%2019%20year%20olds%2C%20males%20and%20wealthier%20SES%20quintiles.%20Proportion%20of%20persons%20covered%20by%20indoor%20residual%20spraying%20%28IRS%29%20was%2066.8%25%20in%20targeted%20zones.%20Proportion%20of%20persons%20using%20other%20insecticides%20than%20IRS%20was%2022.8%25.%20Coverage%20of%20intermittent%20preventive%20treatment%20during%20pregnancy%20was%2021.5%25.%20Exposure%20to%20information%2C%20education%20and%20communication%20messages%20about%20malaria%20was%20significantly%20higher%20in%20wealthier%20SES%20for%20all%20media%20but%20information%20meetings.%20The%20proportion%20of%20fever%20case%20managements%20considered%20as%20appropriate%20with%20regard%20to%20malaria%20was%2015.8%25.%20Malaria%20was%20attributed%20as%20the%20cause%20of%20death%20in%2014.0%25%20of%2086%20VA%2C%20and%2050%25%20of%20these%20deaths%20involved%20persons%20above%20the%20age%20of%20five%20years.%20The%20clinical%20case%20study%20included%20818%20cases%20of%20which%20people%20above%20the%20age%20of%20five%20accounted%20for%2079.7%25.%20In%20targeted%20zones%2C%20coverage%20of%20LLIN%20and%20IRS%20were%20lower%20in%20clinical%20cases%20than%20in%20general%20population.%20CONCLUSIONS%3A%20This%20study%20provides%20valuable%20data%20for%20the%20evaluation%20of%20effectiveness%20and%20factors%20affecting%20MCI.%20MCI%20and%20evaluation%20surveys%20should%20consider%20the%20whole%20population%20and%20not%20only%20focus%20on%20under-fives%20and%20pregnant%20women%20in%20pre-elimination%20or%20elimination%20strategies.%22%2C%22date%22%3A%222014%22%2C%22section%22%3A%22%22%2C%22partNumber%22%3A%22%22%2C%22partTitle%22%3A%22%22%2C%22DOI%22%3A%2210.1186%5C%2F1475-2875-13-465%22%2C%22citationKey%22%3A%22%22%2C%22url%22%3A%22http%3A%5C%2F%5C%2Fwww.ncbi.nlm.nih.gov%5C%2Fpubmed%5C%2F25431003%20http%3A%5C%2F%5C%2Fdownload.springer.com%5C%2Fstatic%5C%2Fpdf%5C%2F586%5C%2Fart%25253A10.1186%25252F1475-2875-13-465.pdf%3ForiginUrl%3Dhttp%253A%252F%252Fhttp%253A%252F%252Fmalariajournal.biomedcentral.com%252Farticle%252F10.1186%252F1475-2875-13-465%26token2%3Dexp%3D1461933945~acl%3D%252Fstatic%252Fpdf%252F586%252Fart%2525253A10.1186%2525252F1475-2875-13-465.pdf%2A~hmac%3D33c397dc5bb8f2494a3b139e08be90cb1cb13f2e46ca5138270df2b61ac9ad72%22%2C%22PMID%22%3A%22%22%2C%22PMCID%22%3A%22%22%2C%22ISSN%22%3A%221475-2875%20%28Electronic%29%201475-2875%20%28Linking%29%22%2C%22language%22%3A%22%22%2C%22collections%22%3A%5B%5D%2C%22dateModified%22%3A%222022-10-03T02%3A03%3A59Z%22%7D%7D%2C%7B%22key%22%3A%22AJPBDH9G%22%2C%22library%22%3A%7B%22id%22%3A4800755%7D%2C%22meta%22%3A%7B%22creatorSummary%22%3A%22Latinne%20et%20al.%22%2C%22parsedDate%22%3A%222013-11-01%22%2C%22numChildren%22%3A1%7D%2C%22bib%22%3A%22%26lt%3Bdiv%20class%3D%26quot%3Bcsl-bib-body%26quot%3B%20style%3D%26quot%3Bline-height%3A%202%3B%20padding-left%3A%201em%3B%20text-indent%3A-1em%3B%26quot%3B%26gt%3B%5Cn%20%20%26lt%3Bdiv%20class%3D%26quot%3Bcsl-entry%26quot%3B%26gt%3BLatinne%2C%20A.%2C%20Chaval%2C%20Y.%2C%20Waengsothorn%2C%20S.%2C%20Rojanadilok%2C%20P.%2C%20Eiamampai%2C%20K.%2C%20Sribuarod%2C%20K.%2C%20Herbreteau%2C%20V.%2C%20Morand%2C%20S.%2C%20%26amp%3B%20Michaux%2C%20J.%20R.%20%282013%29.%20Is%20Leopoldamys%20neilli%20%28Rodentia%2C%20Muridae%29%20a%20synonym%20of%20Leopoldamys%20herberti%3F%20A%20reply%20to%20Balakirev%20et%20al.%20%282013%29.%20%26lt%3Bi%26gt%3BZootaxa%26lt%3B%5C%2Fi%26gt%3B%2C%20%26lt%3Bi%26gt%3B3731%26lt%3B%5C%2Fi%26gt%3B%284%29%2C%20589%26%23x2013%3B598.%20%26lt%3Ba%20class%3D%26%23039%3Bzp-ItemURL%26%23039%3B%20target%3D%26%23039%3B_blank%26%23039%3B%20href%3D%26%23039%3B%3A%5C%2F%5C%2FWOS%3A000326372600010%26%23039%3B%26gt%3B%3A%5C%2F%5C%2FWOS%3A000326372600010%26lt%3B%5C%2Fa%26gt%3B%20%26lt%3Ba%20title%3D%26%23039%3BCite%20in%20RIS%20Format%26%23039%3B%20class%3D%26%23039%3Bzp-CiteRIS%26%23039%3B%20data-zp-cite%3D%26%23039%3Bapi_user_id%3D4800755%26amp%3Bitem_key%3DAJPBDH9G%26%23039%3B%20href%3D%26%23039%3Bjavascript%3Avoid%280%29%3B%26%23039%3B%26gt%3BCite%26lt%3B%5C%2Fa%26gt%3B%20%26lt%3B%5C%2Fdiv%26gt%3B%5Cn%26lt%3B%5C%2Fdiv%26gt%3B%22%2C%22data%22%3A%7B%22itemType%22%3A%22journalArticle%22%2C%22title%22%3A%22Is%20Leopoldamys%20neilli%20%28Rodentia%2C%20Muridae%29%20a%20synonym%20of%20Leopoldamys%20herberti%3F%20A%20reply%20to%20Balakirev%20et%20al.%20%282013%29%22%2C%22creators%22%3A%5B%7B%22creatorType%22%3A%22author%22%2C%22firstName%22%3A%22A.%22%2C%22lastName%22%3A%22Latinne%22%7D%2C%7B%22creatorType%22%3A%22author%22%2C%22firstName%22%3A%22Y.%22%2C%22lastName%22%3A%22Chaval%22%7D%2C%7B%22creatorType%22%3A%22author%22%2C%22firstName%22%3A%22S.%22%2C%22lastName%22%3A%22Waengsothorn%22%7D%2C%7B%22creatorType%22%3A%22author%22%2C%22firstName%22%3A%22P.%22%2C%22lastName%22%3A%22Rojanadilok%22%7D%2C%7B%22creatorType%22%3A%22author%22%2C%22firstName%22%3A%22K.%22%2C%22lastName%22%3A%22Eiamampai%22%7D%2C%7B%22creatorType%22%3A%22author%22%2C%22firstName%22%3A%22K.%22%2C%22lastName%22%3A%22Sribuarod%22%7D%2C%7B%22creatorType%22%3A%22author%22%2C%22firstName%22%3A%22V.%22%2C%22lastName%22%3A%22Herbreteau%22%7D%2C%7B%22creatorType%22%3A%22author%22%2C%22firstName%22%3A%22S.%22%2C%22lastName%22%3A%22Morand%22%7D%2C%7B%22creatorType%22%3A%22author%22%2C%22firstName%22%3A%22J.%20R.%22%2C%22lastName%22%3A%22Michaux%22%7D%5D%2C%22abstractNote%22%3A%22Recently%2C%20Balakirev%20et%20al.%20%282013%29%20presented%20a%20taxonomic%20revision%20of%20the%20genus%20Leopoldamys%20based%20on%20phylogenetic%20analyses.%20They%20identified%20five%20main%20Leopoldamys%20genetic%20lineages%20and%20suggested%20to%20rename%20several%20of%20them.%20According%20to%20these%20authors%2C%20the%20genetic%20lineage%20previously%20thought%20to%20belong%20to%20L.%20edwardsi%20%28lineage%20L1%29%20should%20be%20assigned%20to%20L.%20revertens%20while%20L.%20neilli%20%28lineage%20L2%29%20should%20be%20considered%20as%20a%20junior%20synonym%20of%20L.%20herberti.%20Using%20molecular%20and%20morphological%20data%20from%20a%20large%20sampling%20of%20Leopoldamys%20specimens%2C%20the%20aim%20of%20the%20present%20study%20was%20to%20investigate%20the%20taxonomic%20status%20of%20L.%20herberti%20and%20L.%20neilli.%20This%20study%20reveals%20that%2C%20contrary%20to%20Balakirev%20et%20al.%26%23039%3Bs%20statement%2C%20both%20genetic%20lineages%20L1%20and%20L2%20occur%20in%20Nakhon%20Ratchasima%20Province%2C%20close%20to%20the%20type%20locality%20of%20L.%20herberti.%20We%20also%20show%20that%20the%20external%20measurements%20and%20color%20pattern%20of%20L.%20herberti%20are%20highly%20similar%20to%20those%20of%20L1%20specimens%20but%20are%20not%20consistent%20with%20the%20morphology%20of%20L2%20specimens.%20Therefore%20these%20results%20strongly%20suggest%20that%20L.%20herberti%20should%20be%20assigned%20to%20the%20genetic%20lineage%20L1.%20Consequently%20L.%20neilli%20should%20not%20be%20considered%20as%20a%20junior%20synonym%20of%20L.%20herberti%20and%20this%20study%20confirms%20that%20the%20appropriate%20name%20of%20the%20genetic%20lineage%20L2%20is%20L.%20neilli.%20Moreover%2C%20as%20our%20results%20show%20that%20L.%20herberti%20should%20be%20assigned%20to%20the%20lineage%20L1%2C%20this%20name%20has%20nomenclatural%20priority%20over%20L.%20revertens%2C%20the%20species%20name%20suggested%20by%20Balakirev%20et%20al.%20%282013%29%20for%20this%20lineage.%22%2C%22date%22%3A%222013%20Nov%201%22%2C%22section%22%3A%22%22%2C%22partNumber%22%3A%22%22%2C%22partTitle%22%3A%22%22%2C%22DOI%22%3A%22%22%2C%22citationKey%22%3A%22%22%2C%22url%22%3A%22%3A%5C%2F%5C%2FWOS%3A000326372600010%22%2C%22PMID%22%3A%22%22%2C%22PMCID%22%3A%22%22%2C%22ISSN%22%3A%221175-5326%22%2C%22language%22%3A%22English%22%2C%22collections%22%3A%5B%5D%2C%22dateModified%22%3A%222022-10-03T02%3A03%3A59Z%22%7D%7D%2C%7B%22key%22%3A%227Z2HAWPB%22%2C%22library%22%3A%7B%22id%22%3A4800755%7D%2C%22meta%22%3A%7B%22creatorSummary%22%3A%22Pag%5Cu00e8s%20et%20al.%22%2C%22parsedDate%22%3A%222013-02%22%2C%22numChildren%22%3A1%7D%2C%22bib%22%3A%22%26lt%3Bdiv%20class%3D%26quot%3Bcsl-bib-body%26quot%3B%20style%3D%26quot%3Bline-height%3A%202%3B%20padding-left%3A%201em%3B%20text-indent%3A-1em%3B%26quot%3B%26gt%3B%5Cn%20%20%26lt%3Bdiv%20class%3D%26quot%3Bcsl-entry%26quot%3B%26gt%3BPag%26%23xE8%3Bs%2C%20M.%2C%20Bazin%2C%20E.%2C%20Galan%2C%20M.%2C%20Chaval%2C%20Y.%2C%20Claude%2C%20J.%2C%20Herbreteau%2C%20V.%2C%20Michaux%2C%20J.%2C%20Piry%2C%20S.%2C%20Morand%2C%20S.%2C%20%26amp%3B%20Cosson%2C%20J.%20F.%20%282013%29.%20Cytonuclear%20discordance%20among%20Southeast%20Asian%20black%20rats%20%28Rattus%20rattus%20complex%29.%20%26lt%3Bi%26gt%3BMolecular%20Ecology%26lt%3B%5C%2Fi%26gt%3B%2C%20%26lt%3Bi%26gt%3B22%26lt%3B%5C%2Fi%26gt%3B%284%29%2C%201019%26%23x2013%3B1034.%20%26lt%3Ba%20class%3D%26%23039%3Bzp-DOIURL%26%23039%3B%20target%3D%26%23039%3B_blank%26%23039%3B%20href%3D%26%23039%3Bhttps%3A%5C%2F%5C%2Fdoi.org%5C%2F10.1111%5C%2FMec.12149%26%23039%3B%26gt%3Bhttps%3A%5C%2F%5C%2Fdoi.org%5C%2F10.1111%5C%2FMec.12149%26lt%3B%5C%2Fa%26gt%3B%20%26lt%3Ba%20title%3D%26%23039%3BCite%20in%20RIS%20Format%26%23039%3B%20class%3D%26%23039%3Bzp-CiteRIS%26%23039%3B%20data-zp-cite%3D%26%23039%3Bapi_user_id%3D4800755%26amp%3Bitem_key%3D7Z2HAWPB%26%23039%3B%20href%3D%26%23039%3Bjavascript%3Avoid%280%29%3B%26%23039%3B%26gt%3BCite%26lt%3B%5C%2Fa%26gt%3B%20%26lt%3B%5C%2Fdiv%26gt%3B%5Cn%26lt%3B%5C%2Fdiv%26gt%3B%22%2C%22data%22%3A%7B%22itemType%22%3A%22journalArticle%22%2C%22title%22%3A%22Cytonuclear%20discordance%20among%20Southeast%20Asian%20black%20rats%20%28Rattus%20rattus%20complex%29%22%2C%22creators%22%3A%5B%7B%22creatorType%22%3A%22author%22%2C%22firstName%22%3A%22M.%22%2C%22lastName%22%3A%22Pag%5Cu00e8s%22%7D%2C%7B%22creatorType%22%3A%22author%22%2C%22firstName%22%3A%22E.%22%2C%22lastName%22%3A%22Bazin%22%7D%2C%7B%22creatorType%22%3A%22author%22%2C%22firstName%22%3A%22M.%22%2C%22lastName%22%3A%22Galan%22%7D%2C%7B%22creatorType%22%3A%22author%22%2C%22firstName%22%3A%22Y.%22%2C%22lastName%22%3A%22Chaval%22%7D%2C%7B%22creatorType%22%3A%22author%22%2C%22firstName%22%3A%22J.%22%2C%22lastName%22%3A%22Claude%22%7D%2C%7B%22creatorType%22%3A%22author%22%2C%22firstName%22%3A%22V.%22%2C%22lastName%22%3A%22Herbreteau%22%7D%2C%7B%22creatorType%22%3A%22author%22%2C%22firstName%22%3A%22J.%22%2C%22lastName%22%3A%22Michaux%22%7D%2C%7B%22creatorType%22%3A%22author%22%2C%22firstName%22%3A%22S.%22%2C%22lastName%22%3A%22Piry%22%7D%2C%7B%22creatorType%22%3A%22author%22%2C%22firstName%22%3A%22S.%22%2C%22lastName%22%3A%22Morand%22%7D%2C%7B%22creatorType%22%3A%22author%22%2C%22firstName%22%3A%22J.%20F.%22%2C%22lastName%22%3A%22Cosson%22%7D%5D%2C%22abstractNote%22%3A%22Black%20rats%20are%20major%20invasive%20vertebrate%20pests%20with%20severe%20ecological%2C%20economic%20and%20health%20impacts.%20Remarkably%2C%20their%20evolutionary%20history%20has%20received%20little%20attention%2C%20and%20there%20is%20no%20firm%20agreement%20on%20how%20many%20species%20should%20be%20recognized%20within%20the%20black%20rat%20complex.%20This%20species%20complex%20is%20native%20to%20India%20and%20Southeast%20Asia.%20According%20to%20current%20taxonomic%20classification%2C%20there%20are%20three%20taxa%20living%20in%20sympatry%20in%20several%20parts%20of%20Thailand%2C%20Cambodia%20and%20Lao%20People%26%23039%3Bs%20Democratic%20Republic%2C%20where%20this%20study%20was%20conducted%3A%20two%20accepted%20species%20%28Rattus%20tanezumi%2C%20Rattus%20sakeratensis%29%20and%20an%20additional%20mitochondrial%20lineage%20of%20unclear%20taxonomic%20status%20referred%20to%20here%20as%20Rattus%20R3.%20We%20used%20extensive%20sampling%2C%20morphological%20data%20and%20diverse%20genetic%20markers%20differing%20in%20rates%20of%20evolution%20and%20parental%20inheritance%20%28two%20mitochondrial%20DNA%20genes%2C%20one%20nuclear%20gene%20and%20eight%20microsatellite%20loci%29%20to%20assess%20the%20reproductive%20isolation%20of%20these%20three%20taxa.%20Two%20close%20Asian%20relatives%2C%20Rattus%20argentiventer%20and%20Rattus%20exulans%2C%20were%20also%20included%20in%20the%20genetic%20analyses.%20Genetic%20analyses%20revealed%20discordance%20between%20the%20mitochondrial%20and%20nuclear%20data.%20Mitochondrial%20phylogeny%20studies%20identified%20three%20reciprocally%20monophyletic%20clades%20in%20the%20black%20rat%20complex.%20However%2C%20studies%20of%20the%20phylogeny%20of%20the%20nuclear%20exon%20interphotoreceptor%20retinoid-binding%20protein%20gene%20and%20clustering%20and%20assignation%20analyses%20with%20eight%20microsatellites%20failed%20to%20separate%20R.%20tanezumi%20and%20R3.%20Morphometric%20analyses%20were%20consistent%20with%20nuclear%20data.%20The%20incongruence%20between%20mitochondrial%20and%20nuclear%20%28and%20morphological%29%20data%20rendered%20R.%20tanezumi%5C%2FR3%20paraphyletic%20for%20mitochondrial%20lineages%20with%20respect%20to%20R.%20sakeratensis.%20Various%20evolutionary%20processes%2C%20such%20as%20shared%20ancestral%20polymorphism%20and%20incomplete%20lineage%20sorting%20or%20hybridization%20with%20massive%20mitochondrial%20introgression%20between%20species%2C%20may%20account%20for%20this%20unusual%20genetic%20pattern%20in%20mammals.%22%2C%22date%22%3A%222013%20Feb%22%2C%22section%22%3A%22%22%2C%22partNumber%22%3A%22%22%2C%22partTitle%22%3A%22%22%2C%22DOI%22%3A%2210.1111%5C%2FMec.12149%22%2C%22citationKey%22%3A%22%22%2C%22url%22%3A%22%3A%5C%2F%5C%2FWOS%3A000314220900010%22%2C%22PMID%22%3A%22%22%2C%22PMCID%22%3A%22%22%2C%22ISSN%22%3A%220962-1083%22%2C%22language%22%3A%22English%22%2C%22collections%22%3A%5B%5D%2C%22dateModified%22%3A%222022-10-03T02%3A03%3A59Z%22%7D%7D%5D%7D


  Chaumeau, V., Kularbkeeree, T., Gloria, N., Jaruwan, N., Sawasdichai, S., Pateekhum, C., Girond, F., Herbreteau, V., & Nosten, F. (2025). Assessment of mosquito species communities biting humans and their livestock in the forest hills of Karen state, Myanmar: a cross-sectional survey in six villages. Parasites & Vectors. https://doi.org/10.1186/s13071-025-07217-9 Cite


  Herbreteau, V., Maquart, P.-O., Hoeun, S., Doeurk, B., Girond, F., & Boyer, S. (2025). Spatio-temporal distribution and environmental determinants of dengue vectors in Phnom Penh, Cambodia. PLOS Neglected Tropical Diseases, 19(10), e0013667. https://doi.org/10.1371/journal.pntd.0013667 Cite


  Kliengchuay, W., Phonphan, W., Niampradit, S., Kiangkoo, N., Srimanus, W., Niemmanee, T., Arunplod, C., Wen, B., Guo, Y., Herbreteau, V., & Tantrakarnapa, K. (2025). Variation of vegetation cover and the relationship with land surface temperature across Thailand (2007 to 2022). Scientific Reports, 15(1), 27823. https://doi.org/10.1038/s41598-025-13018-y Cite


  Randriamihaja, M., Randrianjatovo, T. M., Evans, M. V., Ihantamalala, F. A., Herbreteau, V., Révillion, C., Delaitre, E., Catry, T., & Garchitorena, A. (2025). Monitoring individual rice field flooding dynamics over a large scale to improve mosquito surveillance and control. Malaria Journal, 24(1), 107. https://doi.org/10.1186/s12936-025-05344-3 Cite


  Evans, M. V., Ihantamalala, F. A., Randriamihaja, M., Herbreteau, V., Révillion, C., Catry, T., Delaitre, E., Bonds, M. H., Roche, B., Mitsinjoniala, E., Ralaivavikoa, F. A., Razafinjato, B., Raobela, O., & Garchitorena, A. (2025). Increasing the resolution of malaria early warning systems for use by local health actors. Malaria Journal, 24(1), 30. https://doi.org/10.1186/s12936-025-05266-0 Cite


  Daudé, É., Paul, R., Cebeillac, A., Girond, F., Herbreteau, V., & Boyer, S. (2025). La dengue en Asie du Sud-Est: Enjeux pour un système de surveillance transnational : Thaïlande, Laos, Cambodge et Viêtnam. In G. Facal & J. Samuel (Eds.), L’Asie du Sud-Est 2025 (pp. 79–105). Institut de recherche sur l’Asie du Sud-Est contemporaine. https://doi.org/10.4000/13g86 Cite


  Tantely, M. L., Guis, H., Raharinirina, M. R., Ambinintsoa, M. F., Randriananjantenaina, I., Velonirina, H. J., Revillion, C., Herbreteau, V., Tran, A., & Girod, R. (2024). Mosquito dynamics and their drivers in peri-urban Antananarivo, Madagascar: insights from a longitudinal multi-host single-site survey. Parasites & Vectors, 17(1), 383. https://doi.org/10.1186/s13071-024-06393-4 Cite


  Yean, S., Prasetyo, D. B., Marcombe, S., Hadi, U. K., Kazim, A. R., Tiawsirisup, S., Chinh, V. D., Matsuno, K., Low, V. L., Bonnet, S., Boulanger, N., Lam, T. T.-Y., Abdad, M. Y., Herbreteau, V., Chavatte, J.-M., Sum, S., Ren, T., Sakuntabhai, A., Maquart, P.-O., … Boyer, S. (2024). Challenges for ticks and tick-borne diseases research in Southeast Asia: Insight from the first international symposium in Cambodia. PLOS Neglected Tropical Diseases, 18(7), e0012269. https://doi.org/10.1371/journal.pntd.0012269 Cite


  Douchet, L., Menkes, C., Herbreteau, V., Larrieu, J., Bador, M., Goarant, C., & Mangeas, M. (2024). Climate-driven models of leptospirosis dynamics in tropical islands from three oceanic basins. PLOS Neglected Tropical Diseases, 18(4), e0011717. https://doi.org/10.1371/journal.pntd.0011717 Cite


  Legendre, E., Lehot, L., Dieng, S., Rebaudet, S., Thu, A. M., Rae, J. D., Delmas, G., Girond, F., Herbreteau, V., Nosten, F., Landier, J., & Gaudart, J. (2023). Malaria Temporal Dynamic Clustering for Surveillance and Intervention Planning. Epidemics, 100682. https://doi.org/10.1016/j.epidem.2023.100682 Cite


  Chaumeau, V., Kajeechiwa, L., Kulabkeeree, T., Sawasdichai, S., Haohankhunnatham, W., Inta, A., Phanaphadungtham, M., Girond, F., Herbreteau, V., Delmas, G., & Nosten, F. (2022). Outdoor residual spraying for malaria vector-control in Kayin (Karen) state, Myanmar: A cluster randomized controlled trial. PLOS ONE, 17(9), e0274320. https://doi.org/10.1371/journal.pone.0274320 Cite


  Bonnin, L., Tran, A., Herbreteau, V., Marcombe, S., Boyer, S., Mangeas, M., & Menkes, C. (2022). Predicting the Effects of Climate Change on Dengue Vector Densities in Southeast Asia through Process-Based Modeling. Environmental Health Perspectives, 130(12), 127002. https://doi.org/10.1289/EHP11068 Cite


  Cristaldi, M. A., Catry, T., Pottier, A., Herbreteau, V., Roux, E., Jacob, P., & Previtali, M. A. (2022). Determining the spatial distribution of environmental and socio-economic suitability for human leptospirosis in the face of limited epidemiological data. Infectious Diseases of Poverty, 11(1), 86. https://doi.org/10.1186/s40249-022-01010-x Cite


  Douchet, L., Goarant, C., Mangeas, M., Menkes, C., Hinjoy, S., & Herbreteau, V. (2022). Unraveling the invisible leptospirosis in mainland Southeast Asia and its fate under climate change. Science of The Total Environment, 832, 155018. https://doi.org/10.1016/j.scitotenv.2022.155018 Cite


  Ihantamalala, F. A., Bonds, M. H., Randriamihaja, M., Rakotonirina, L., Herbreteau, V., Révillion, C., Rakotoarimanana, S., Cowley, G., Andriatiana, T. A., Mayfield, A., Rich, M. L., Rakotonanahary, R. J. L., Finnegan, K. E., Ramarson, A., Razafinjato, B., Ramiandrisoa, B., Randrianambinina, A., Cordier, L. F., & Garchitorena, A. (2021). Geographic barriers to establishing a successful hospital referral system in rural Madagascar. BMJ Global Health, 6(12), e007145. https://doi.org/10.1136/bmjgh-2021-007145 Cite


  Chhim, S., Piola, P., Housen, T., Herbreteau, V., & Tol, B. (2021). Malaria in Cambodia: A Retrospective Analysis of a Changing Epidemiology 2006–2019. International Journal of Environmental Research and Public Health, 18(4), 1960. https://doi.org/10.3390/ijerph18041960 Cite


  Biscornet, L., Révillion, C., Jégo, S., Lagadec, E., Gomard, Y., Le Minter, G., Rocamora, G., Guernier-Cambert, V., Mélade, J., Dellagi, K., Tortosa, P., & Herbreteau, V. (2021). Predicting the Presence of Leptospires in Rodents from Environmental Indicators Opens Up Opportunities for Environmental Monitoring of Human Leptospirosis. Remote Sensing, 13(2), 325. https://doi.org/10.3390/rs13020325 Cite


  Garchitorena, A., Ihantamalala, F. A., Révillion, C., Cordier, L. F., Randriamihaja, M., Razafinjato, B., Rafenoarivamalala, F. H., Finnegan, K. E., Andrianirinarison, J. C., Rakotonirina, J., Herbreteau, V., & Bonds, M. H. (2021). Geographic barriers to achieving universal health coverage: evidence from rural Madagascar. Health Policy and Planning, czab087. https://doi.org/10.1093/heapol/czab087 Cite


  Legendre, E., Landier, J., Lehot, L., Dieng, S., Thu, A., Drae, J., Delmas, G., Girond, F., Herbreteau, V., Nosten, F., & Gaudart, J. (2021). Classification de dynamiques temporelles de paludisme à l’échelle du village dans le cadre d’un programme d’élimination du paludisme. Revue d’Épidémiologie et de Santé Publique, 69, S20. https://doi.org/10.1016/j.respe.2021.04.032 Cite


  Attoumane, A., Silai, R., Bacar, A., Cardinale, E., Pennober, G., & Herbreteau, V. (2020). Changing Patterns of Malaria in Grande Comore after a Drastic Decline: Importance of Fine-Scale Spatial Analysis to Inform Future Control Actions. Remote Sensing, 12(24), 4082. https://doi.org/10.3390/rs12244082 Cite


  Pepey, A., Souris, M., Vantaux, A., Morand, S., Lek, D., Mueller, I., Witkowski, B., & Herbreteau, V. (2020). Studying Land Cover Changes in a Malaria-Endemic Cambodian District: Considerations and Constraints. Remote Sensing, 12(18), 2972. https://doi.org/10.3390/rs12182972 Cite


  Marti, R., Li, Z., Catry, T., Roux, E., Mangeas, M., Handschumacher, P., Gaudart, J., Tran, A., Demagistri, L., Faure, J.-F., Carvajal, J. J., Drumond, B., Xu, L., Herbreteau, V., Gurgel, H., Dessay, N., & Gong, P. (2020). A Mapping Review on Urban Landscape Factors of Dengue Retrieved from Earth Observation Data, GIS Techniques, and Survey Questionnaires. Remote Sensing, 12(6), 932. https://doi.org/10.3390/rs12060932 Cite


  Tran, A., Mangeas, M., Demarchi, M., Roux, E., Degenne, P., Haramboure, M., Le Goff, G., Damiens, D., Gouagna, L.-C., Herbreteau, V., & Dehecq, J.-S. (2020). Complementarity of empirical and process-based approaches to modelling mosquito population dynamics with Aedes albopictus as an example—Application to the development of an operational mapping tool of vector populations. PLOS ONE, 15(1), e0227407. https://doi.org/10.1371/journal.pone.0227407 Cite


  Ihantamalala, F. A., Herbreteau, V., Révillion, C., Randriamihaja, M., Commins, J., Andréambeloson, T., Rafenoarimalala, F. H., Randrianambinina, A., Cordier, L. F., Bonds, M. H., & Garchitorena, A. (2020). Improving geographical accessibility modeling for operational use by local health actors. International Journal of Health Geographics, 19(1). https://doi.org/10.1186/s12942-020-00220-6 Cite


  Herbreteau, V. (2020). La leptospirose. In G. Salem & F. Fournet (Eds.), Atlas mondial de la santé (p. 41). Autrement. Cite


  Révillion, C., Attoumane, A., & Herbreteau, V. (2019). Homisland-IO: Homogeneous Land Use/Land Cover over the Small Islands of the Indian Ocean. Data, 4(2), 82. https://doi.org/10.3390/data4020082 Cite


  Lebeau-Desmoulin, L., Bruneau, L., Commins, J., Herbreteau, V., & Raffray, L. (2019). Identifying factors associated with treatment delay in leptospirosis: A retrospective study of patients admitted to hospital in Reunion (Indian Ocean) between 2014 and 2015. Médecine et Maladies Infectieuses. https://doi.org/10.1016/j.medmal.2019.09.008 Cite


  Ihantamalala, F. A., Herbreteau, V., Rakotoarimanana, F. M. J., Rakotondramanga, J. M., Cauchemez, S., Rahoilijaona, B., Pennober, G., Buckee, C. O., Rogier, C., Metcalf, C. J. E., & Wesolowski, A. (2018). Estimating sources and sinks of malaria parasites in Madagascar. Nat Commun, 9(1), 3897. https://doi.org/10.1038/s41467-018-06290-2 Cite


  Girond, F., Madec, Y., Kesteman, T., Randrianarivelojosia, M., Randremanana, R., Randriamampionona, L., Randrianasolo, L., Ratsitorahina, M., Herbreteau, V., Hedje, J., Rogier, C., & Piola, P. (2018). Evaluating Effectiveness of Mass and Continuous Long-lasting Insecticidal Net Distributions Over Time in Madagascar: A Sentinel Surveillance Based Epidemiological Study. EClinicalMedicine, 1, 62–69. https://doi.org/10.1016/j.eclinm.2018.07.003 Cite


  Ouedraogo, B., Inoue, Y., Kambire, A., Sallah, K., Dieng, S., Tine, R., Rouamba, T., Herbreteau, V., Sawadogo, Y., Ouedraogo, L., Yaka, P., Ouedraogo, E. K., Dufour, J. C., & Gaudart, J. (2018). Spatio-temporal dynamic of malaria in Ouagadougou, Burkina Faso, 2011-2015. Malar J, 17(1), 138. https://doi.org/10.1186/s12936-018-2280-y Cite


  Ihantamalala, F. A., Rakotoarimanana, F. M. J., Ramiadantsoa, T., Rakotondramanga, J. M., Pennober, G., Rakotomanana, F., Cauchemez, S., Metcalf, C. J. E., Herbreteau, V., & Wesolowski, A. (2018). Spatial and temporal dynamics of malaria in Madagascar. Malaria Journal, 17(1), 58. https://doi.org/10.1186/s12936-018-2206-8 Cite


  Herbreteau, V., Révillion, C., & Trimaille, E. (2018). GeoHealth and QuickOSM, Two QGIS Plugins for Health Applications. In N. Baghdadi, C. Mallet, & M. Zribi (Eds.), QGIS and Generic Tools (pp. 257–286). John Wiley & Sons, Inc. https://doi.org/10.1002/9781119457091.ch7 Cite


  Catry, T., Li, Z., Roux, E., Herbreteau, V., Gurgel, H., Mangeas, M., Seyler, F., & Dessay, N. (2018). Wetlands and Malaria in the Amazon: Guidelines for the Use of Synthetic Aperture Radar Remote-Sensing. International Journal of Environmental Research and Public Health, 15(3), 468. http://www.mdpi.com/1660-4601/15/3/468 Cite


  Randrianaivo, H., Bertaut-Nativel, B., André, M., Irabe, M., Robillard, P.-Y., Boumahni, B., Mangeas, M., Roux, E., Brou, T. Y., Gérardin, P., Filleul, L., & Herbreteau, V. (2018). Mise en place d’une surveillance spatialisée des malformations congénitales à La Réunion : choix méthodologiques. Bulletin Epidémiologique Hebdomadaire, 2, 38–44. http://invs.santepubliquefrance.fr/beh/2018/2/2018_2_2.html Cite


  Owers, K. A., Hinjoy, S., Childs, J. E., Herbreteau, V., Diggle, P. J., & Ko, A. I. (2017). Timing and spatial heterogeneity of leptospirosis transmission in Northeast Thailand. American Journal of Tropical Medicine and Hygiene, 97(5, S), 618. Cite


  Girond, F., Randrianasolo, L., Randriamampionona, L., Rakotomanana, F., Randrianarivelojosia, M., Ratsitorahina, M., Brou, T. Y., Herbreteau, V., Mangeas, M., Zigiumugabe, S., Hedje, J., Rogier, C., & Piola, P. (2017). Analysing trends and forecasting malaria epidemics in Madagascar using a sentinel surveillance network: a web-based application. Malaria Journal, 16(1), 72. https://doi.org/10.1186/s12936-017-1728-9 Cite


  Ihantamalala, F. A., Herbreteau, V., Rakotondramanga, J. M., Pennober, G., Rahoilijaona, B., Metcalf, C. J. E., Buckee, C. O., Rakotomanana, F., Rogier, C., & Wesolowski, A. (2016). Spatiotemporal epidemiology of malaria in Madagascar between 2006 and 2015. International Journal of Infectious Diseases, 45, 58–59. https://doi.org/10.1016/j.ijid.2016.02.173 Cite


  Tran, A., Kassié, D., & Herbreteau, V. (2016). Applications of Remote Sensing to the Epidemiology of Infectious Diseases: Some Examples. In N. Baghdadi & M. Zribi (Eds.), Land Surface Remote Sensing: Environment and Risks (pp. 295–315). Elsevier. Cite


  André, M., Randrianaivo, H., Bertaud-Nativel, B., & Herbreteau, V. (2016). Spatial investigation of congenital malformations in Reunion Island (2008-2012). Birth Defects Research Part A: Clinical and Molecular Teratology, 106, 509–509. Cite


  Attoumane, A., Silai, R., Bacar, A., Revillion, C., Cardinale, E., Pennober, G., & Herbreteau, V. (2015). Spatial analysis of malaria distribution in the Union of Comoros. Tropical Medicine & International Health, 20, 224–224. ://WOS:000360758801136 Cite


  Bordes, F., Morand, S., Pilosof, S., Claude, J., Krasnov, B. R., Cosson, J. F., Chaval, Y., Ribas, A., Chaisiri, K., Blasdell, K., Herbreteau, V., Dupuy, S., & Tran, A. (2015). Habitat fragmentation alters the properties of a host-parasite network: rodents and their helminths in South-East Asia. Journal of Animal Ecology, 84(5), 1253–1263. https://doi.org/10.1111/1365-2656.12368 Cite


  Herbreteau, V., Tantrakarnapa, K., Khaungaew, W., & Janeau, J.-L. (2015). Water and Health: What Is the Risk and Visible Burden of the Exposure to Environmental Contaminations? Insights from a Questionnaire-Based Survey in Northern Thailand. In S. Morand, J.-P. Dujardin, R. Lefait-Robin, & C. Apiwathnasorn (Eds.), Socio-Ecological Dimensions of Infectious Diseases in Southeast Asia (pp. 75–88). Springer Singapore. https://doi.org/10.1007/978-981-287-527-3_6 Cite


  Latinne, A., Meynard, C. N., Herbreteau, V., Waengsothorn, S., Morand, S., & Michaux, J. R. (2015). Influence of past and future climate changes on the distribution of three Southeast Asian murine rodents. Journal of Biogeography, 42(9), 1714–1726. https://doi.org/10.1111/jbi.12528 Cite


  Morand, S., Bordes, F., Blasdell, K., Pilosof, S., Cornu, J.-F., Chaisiri, K., Chaval, Y., Cosson, J.-F., Claude, J., Feyfant, T., Herbreteau, V., Dupuy, S., & Tran, A. (2015). Assessing the distribution of disease-bearing rodents in human-modified tropical landscapes. Journal of Applied Ecology, 52(3), 784–794. https://doi.org/10.1111/1365-2664.12414 Cite


  Révillion, C., Lagadec, E., Le Minter, G., Dessay, N., Guernier, V., Sand, A., Tortosa, P., Dellagi, K., & Herbreteau, V. (2015). Utilisation de la très haute résolution spatiale pour la caractérisation des habitats de rongeurs, vecteurs de zoonoses à la Réunion. Revue Française de Photogrammétrie et de Télédétection, 209, 65–71. Cite


  Pakdeenarong, N., Siribat, P., Chaisiri, K., Douangboupha, B., Ribas, A., Chaval, Y., Herbreteau, V., & Morand, S. (2014). Helminth communities in murid rodents from southern and northern localities in Lao PDR: the role of habitat and season. J Helminthol, 88(3), 302–309. https://doi.org/10.1017/S0022149X13000187 Cite


  Cosson, J. F., Picardeau, M., Mielcarek, M., Tatard, C., Chaval, Y., Suputtamongkol, Y., Buchy, P., Jittapalapong, S., Herbreteau, V., & Morand, S. (2014). Epidemiology of Leptospira transmitted by rodents in Southeast Asia. PLoS Negl Trop Dis, 8(6), e2902. https://doi.org/10.1371/journal.pntd.0002902 Cite


  Kesteman, T., Randrianarivelojosia, M., Mattern, C., Raboanary, E., Pourette, D., Girond, F., Raharimanga, V., Randrianasolo, L., Piola, P., & Rogier, C. (2014). Nationwide evaluation of malaria infections, morbidity, mortality, and coverage of malaria control interventions in Madagascar. Malar J, 13, 465. https://doi.org/10.1186/1475-2875-13-465 Cite


  Latinne, A., Chaval, Y., Waengsothorn, S., Rojanadilok, P., Eiamampai, K., Sribuarod, K., Herbreteau, V., Morand, S., & Michaux, J. R. (2013). Is Leopoldamys neilli (Rodentia, Muridae) a synonym of Leopoldamys herberti? A reply to Balakirev et al. (2013). Zootaxa, 3731(4), 589–598. ://WOS:000326372600010 Cite


  Pagès, M., Bazin, E., Galan, M., Chaval, Y., Claude, J., Herbreteau, V., Michaux, J., Piry, S., Morand, S., & Cosson, J. F. (2013). Cytonuclear discordance among Southeast Asian black rats (Rattus rattus complex). Molecular Ecology, 22(4), 1019–1034. https://doi.org/10.1111/Mec.12149 Cite
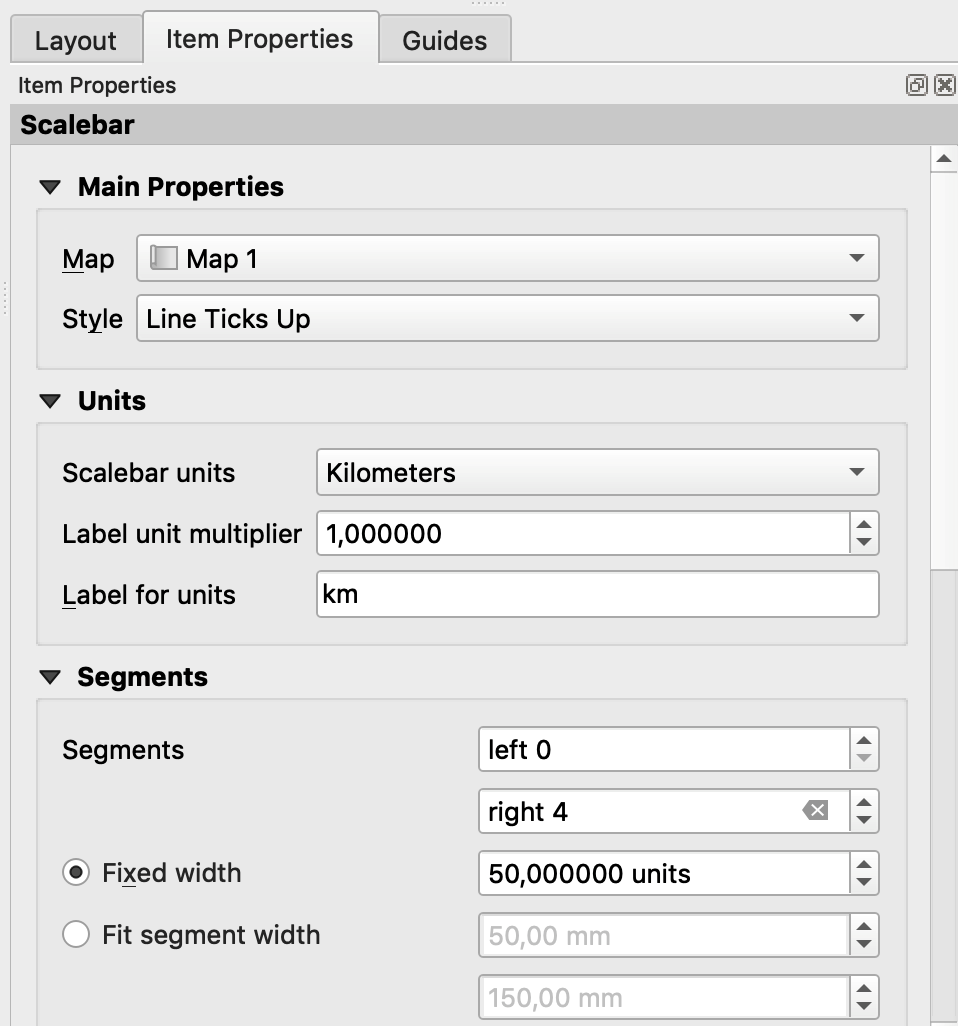
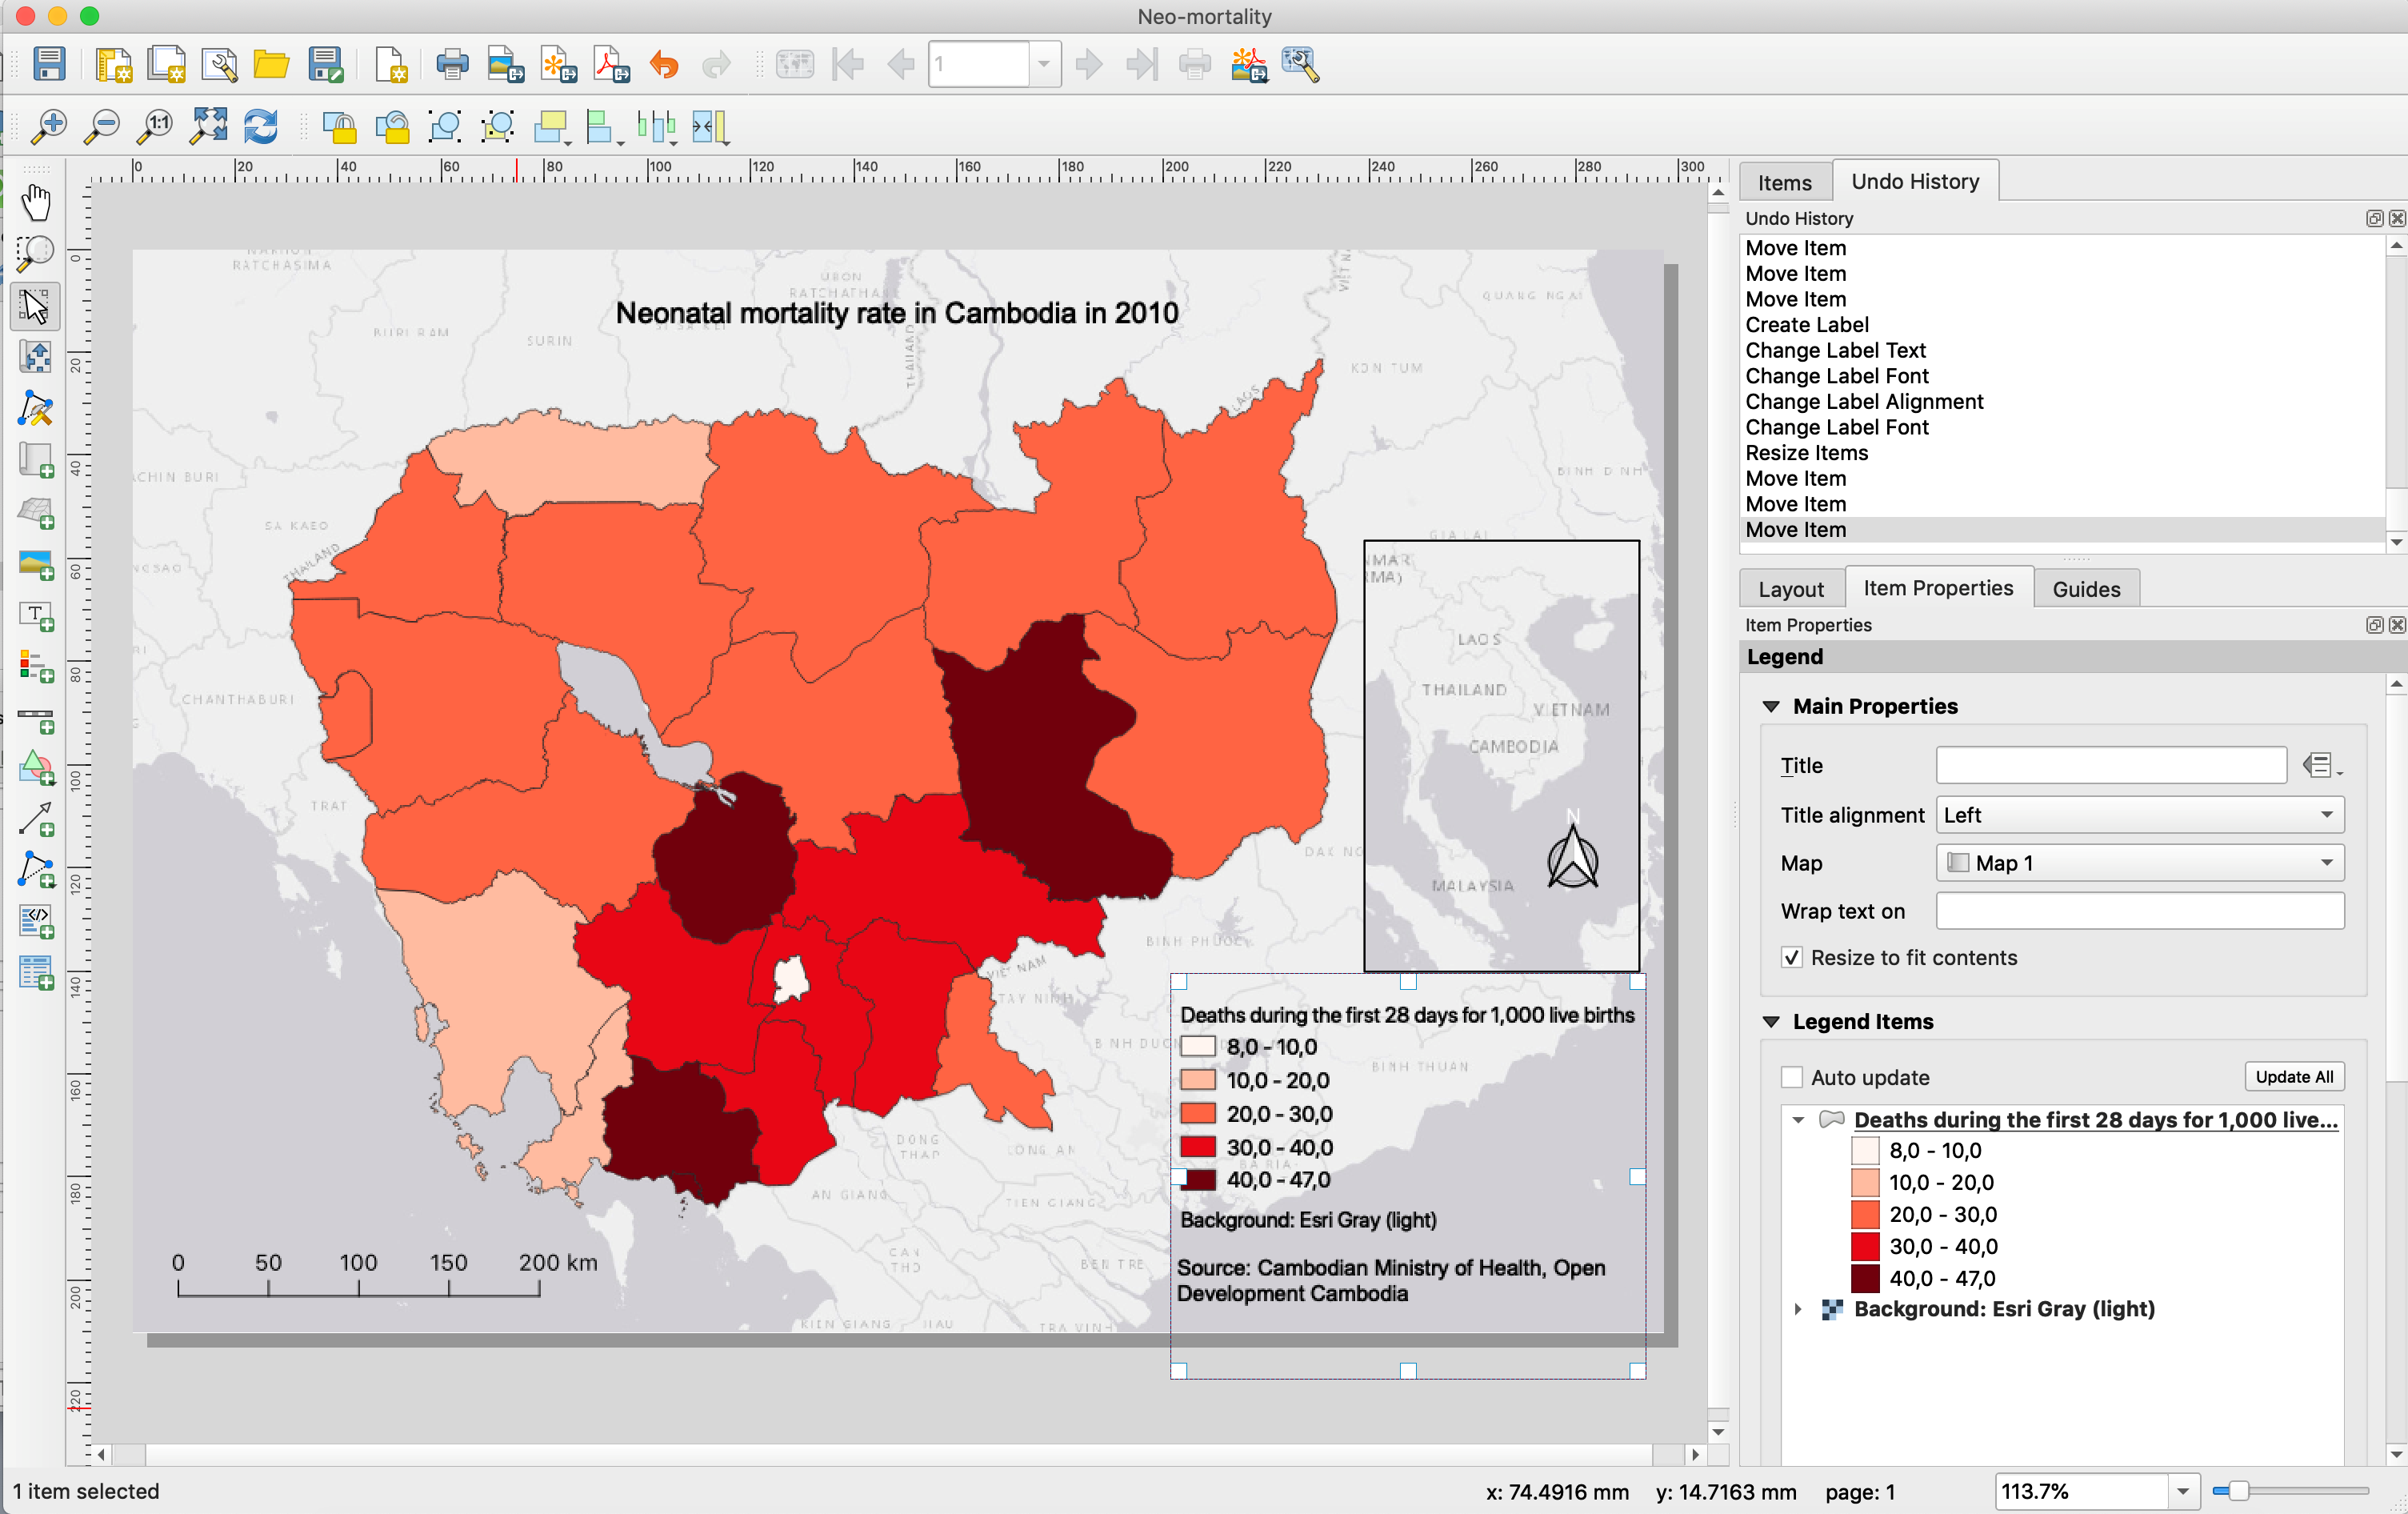
 , choose the “Raster” tab and browse to srtm_cambodia.tif
 to get the weblink to download the chosen image
![]() (or by right-clicking on its name), you can verify that the data attributes (M, F, T) are in a numeric format (right alignment).
(or by right-clicking on its name), you can verify that the data attributes (M, F, T) are in a numeric format (right alignment). , choose the “Delimited Text” tab and browse to your csv file: Hospitals_OSM_PhnomPenh.csv
![]()
![]()
![]()
