
2. Creating a simple map and discovering the different toolbars
2.1 Downloading dataset
Cambodia administrative boundaries, divided in 4 levels:
- level 0: country,
- level 1: province / khaet and capital / reach thani,
- level 2: municipality, district,
- level 3: commune / khum, quarter / sangkat
These contours maps (shapefiles) are made available from the Humanitarian Data Exchange (HDX), provided by OCHA (United Nations Offices for the Coordination of Humanitarian Affairs: https://www.unocha.org/). These maps were originally produced by the Department of Geography of the Ministry of Land Management, Urbanization and Construction in 2008 and unofficially updated in 2014 according to sub-decrees on administrative modifications. They were provided by WFP - VAM unit Cambodia.
You can download these administrative boundaries, as zip folders, here:
https://data.humdata.org/dataset/cambodia-admin-level-0-international-boundaries
- khm_admbnda_adm0_gov_20181004.zip (127.0K)
- khm_admbnda_adm1_gov_20181004.zip (292.6K)
- khm_admbnda_adm2_gov_20181004.zip (589.2K)
- khm_admbnda_adm3_gov_20181004.zip (1.2M)
Population data:
Population data is available at these different levels from the Humanitarian Data Exchange (HDX) repository. It comes from the Commune database (CDB), provided by the Cambodia Ministry of Planning.
https://data.humdata.org/dataset/cambodia-population-statistics
Health Facility data:
The Humanitarian Data Exchange (HDX) repository provides a dataset on the location of health facilities (Referral Hospitals, Health Centers, Health Posts). These maps were originally produced by the Cambodia Ministry of Health (MoH).
https://data.humdata.org/dataset/cambodia-health
Transportation data:
The roads network is available from Humanitarian Data Exchange (HDX) repository. These maps were originally produced by the Cambodia Department of Geography of the Ministry of Land Management, Urbanization and Construction. They include: National road primary and secondary, Provincial road primary, Provincial and rural roads, Foot path, Cart track, Bridge line.
https://data.humdata.org/dataset/cambodia-roads
Hydrology data:
The hydrological network is available from Humanitarian Data Exchange (HDX) repository. These maps were originally produced by the Cambodia Department of Geography of the Ministry of Land Management, Urbanization and Construction. They include: rivers (“Non-Perenial/Intermittent/Fluctuating” and “Perennial/Permanent”), lakes
https://data.humdata.org/dataset/cambodia-water-courses-0
Digital Elevation Model (DEM)
The SRTM (Shuttle Radar Topography Mission) is a free DEM provided by NASA and NGA (formerly NIMA). Space Shuttle Endeavour (STS-99) collected these altimetry data during an 11-day mission in February 2000 at an altitude of 233 km using radar interferometry. The SRTM covers nearly 80% of the land area from 56° South latitude to 60° North latitude. Spatial resolution is approximately 30 meters on the line of the Equator.
The SRTM data can be downloaded here: http://srtm.csi.cgiar.org
2.2 Creating a project
QGIS starts with an untitled project but displays in the canvas the list of recent projects. By double-clicking on one of these recent projects, QGIS will quickly open it.
- You can start by saving your future project (file extension .qgz) :
In Menu Project -> Save as…
or by using the File Toolbar![]()
Note: Remember to frequently save your project!
2.3 Adding a vector layer
Note: Vector layers can be points, polylines or polygons.
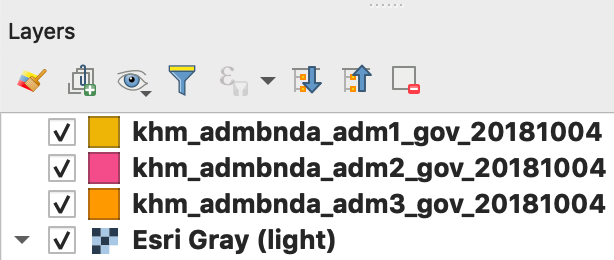
- Add the four levels of Cambodian administrative layers (provinces, districts, communes) to the project:
- khm_admbnda_adm0_gov_20181004.shp (country)
- khm_admbnda_adm0_gov_20181004.shp (provinces)
- khm_admbnda_adm0_gov_20181004.shp (districts)
- khm_admbnda_adm0_gov_20181004.shp (communes)
- Add the four levels of Cambodian administrative layers (provinces, districts, communes) to the project:
There are several ways to add data to the project
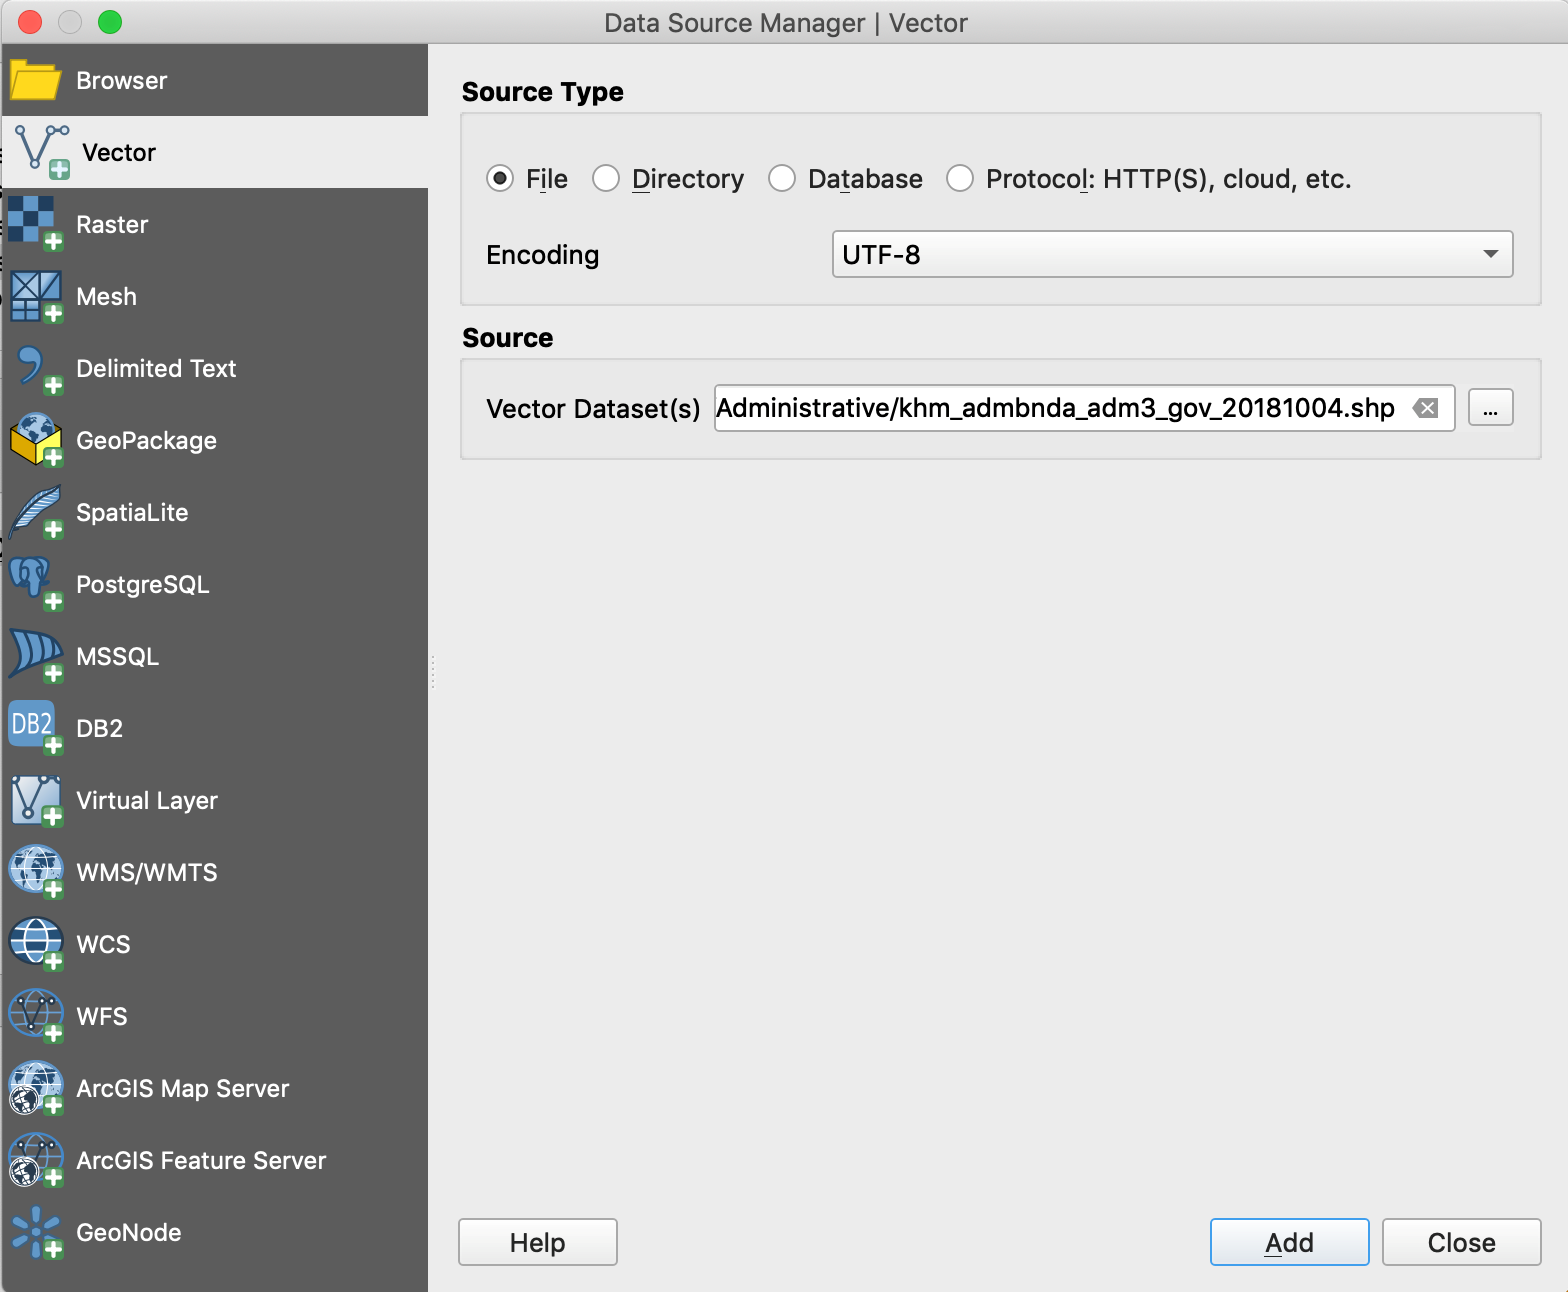
- By using the Data Source Manager
- Open the Data Source Mangager by clicking on its icon in the Data Source Manager Toolbar
- Select the type of data to open : Vector / Raster / Delimited Text (csv) / etc.
- Browse to your file
- Click on Add button
- By using the Browser panel
- Find the .shp files in your folders
- Double-click the .shp files directly or drag and drop it to the map canvas
- By directly dragging and dropping the .shp files from your browser to QGIS
Note: You can select and open several files together with Ctrl or Shift keys.
Note: You can drag and drop layers in the table of contents to modify the order of appearance of the layers
2.4 Adding a basemap
QGIS 3 makes it very easy to add background maps (OpenStreetMap, Bing, MapBox, Google, etc.). Of course, this requires Internet connection.
Examples of basemap from different providers:
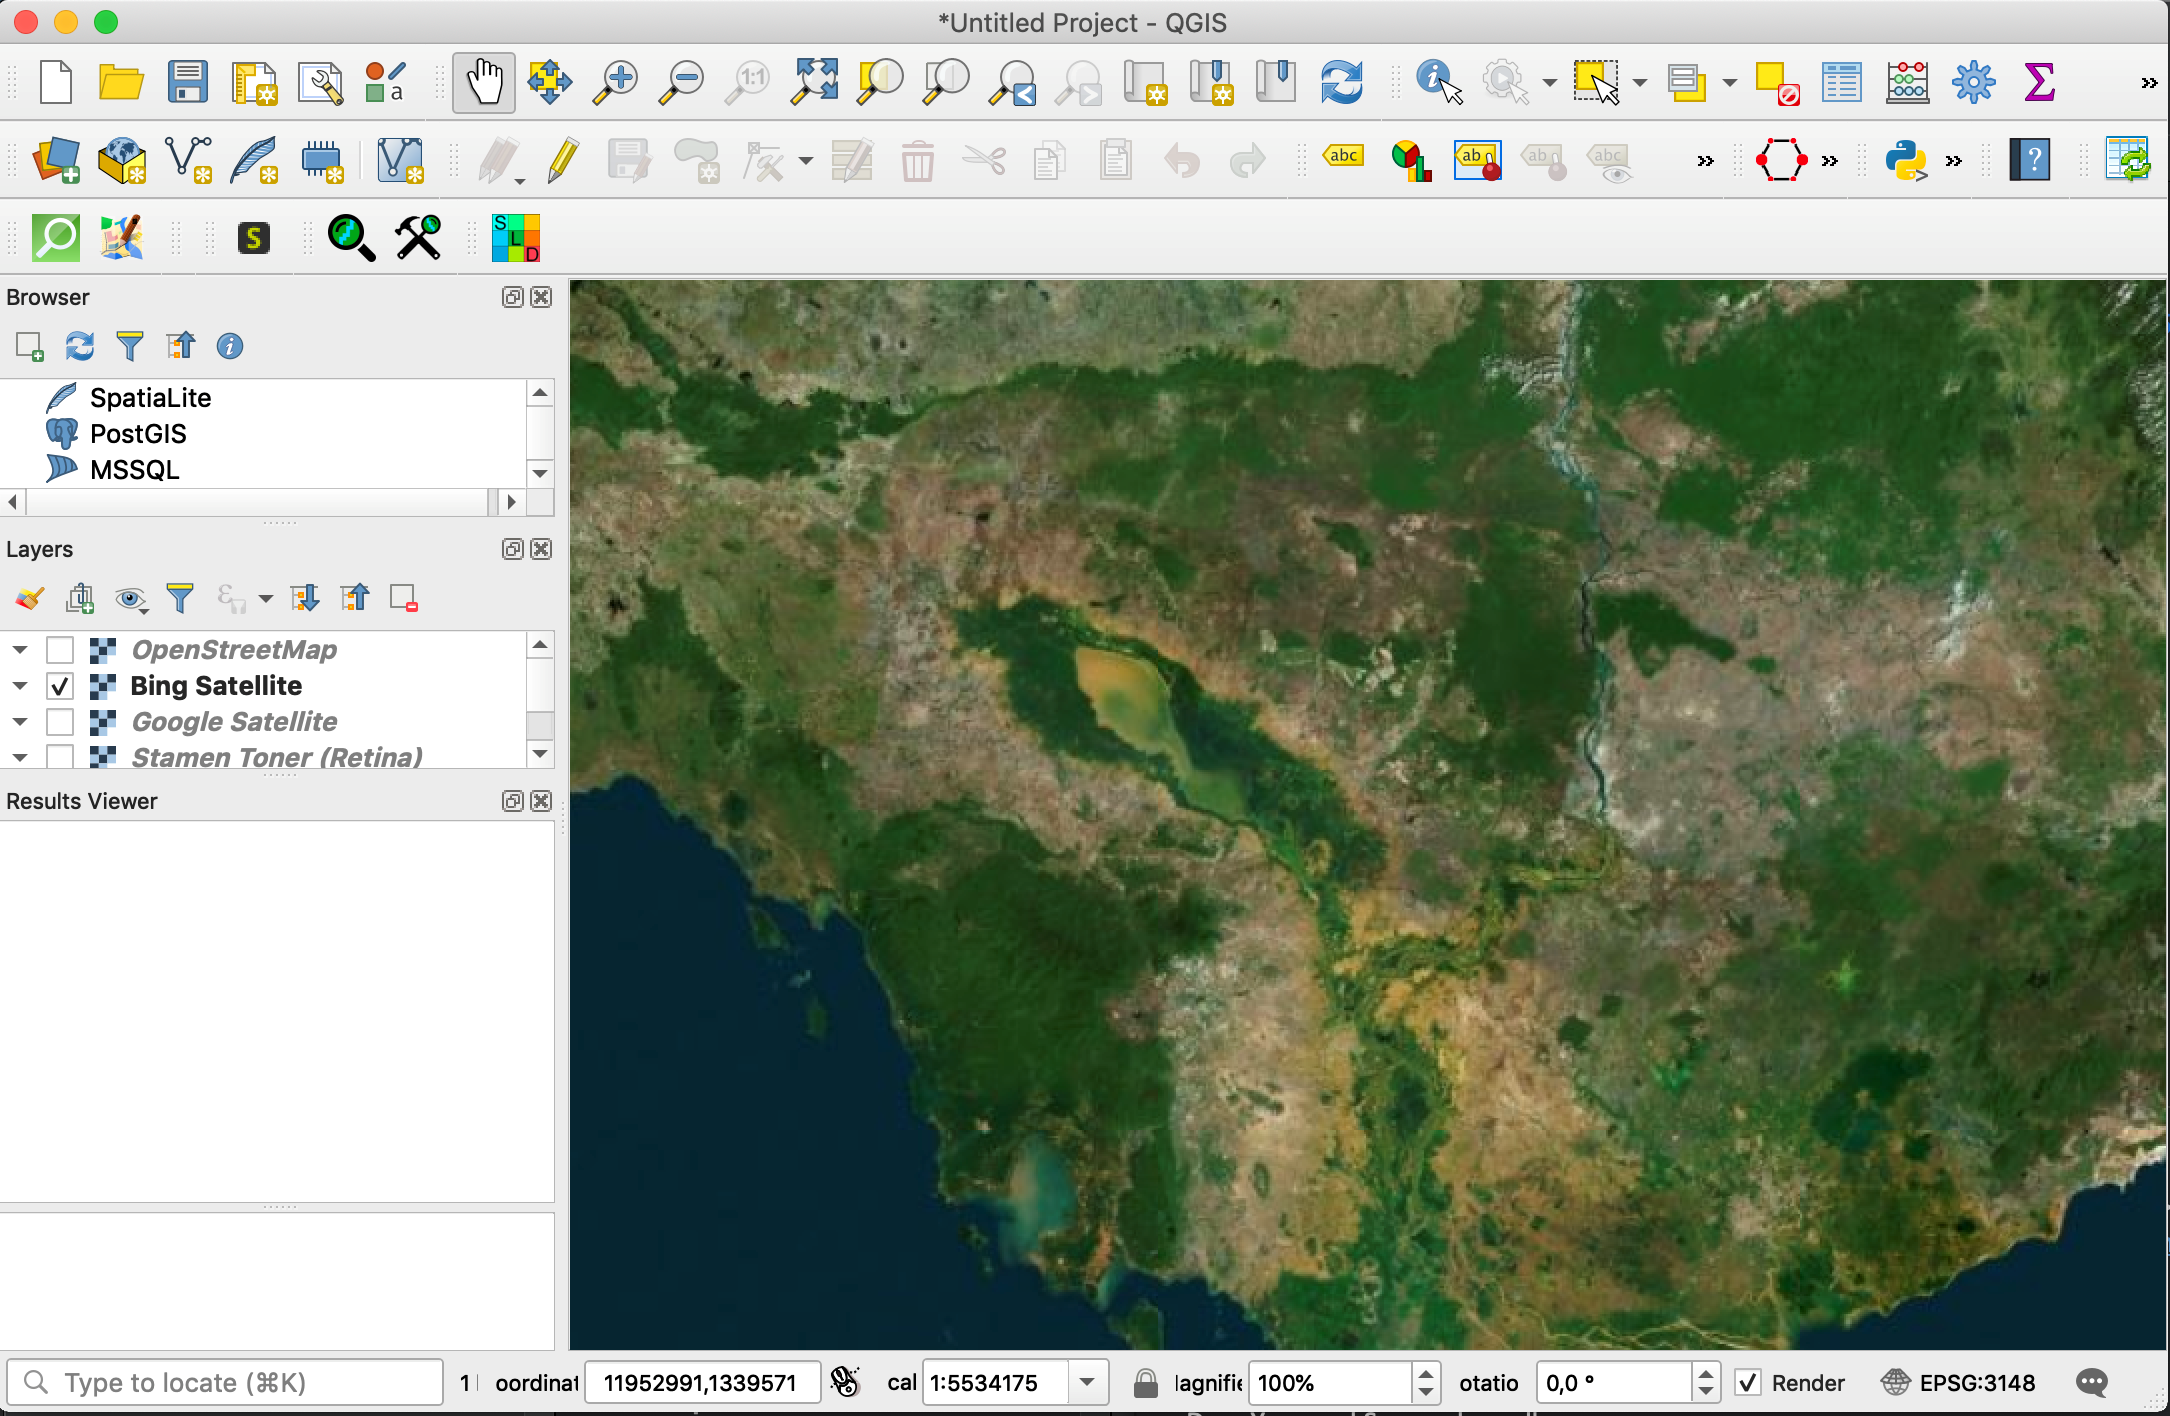
Microsoft Bing Satelitte basemap
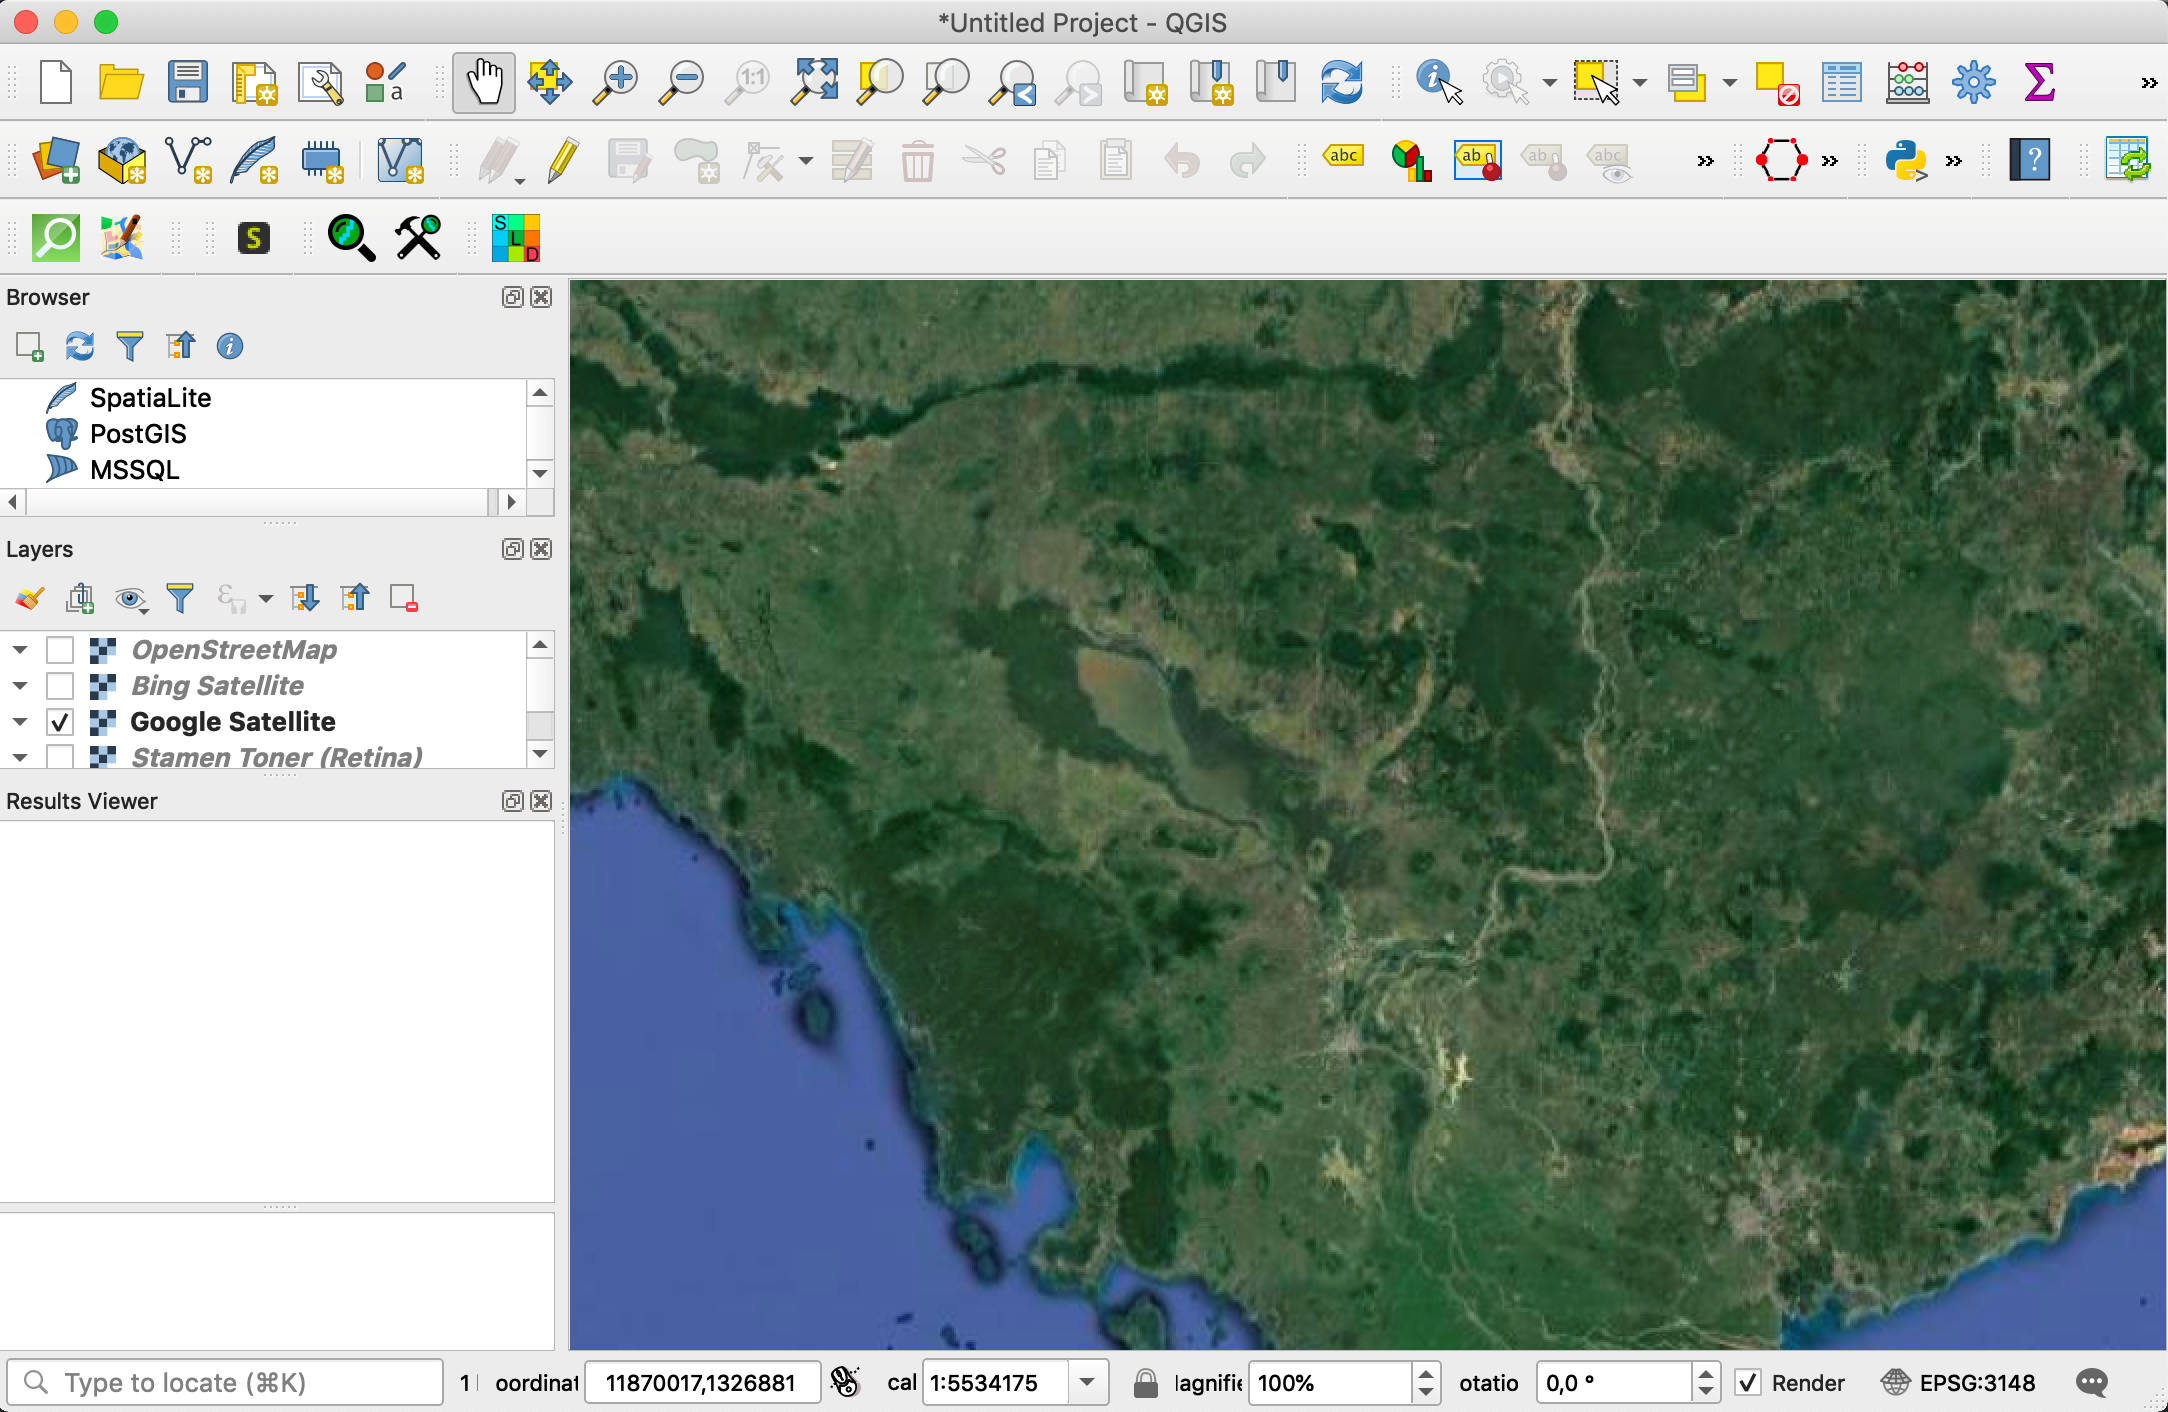
Google Satelitte basemap
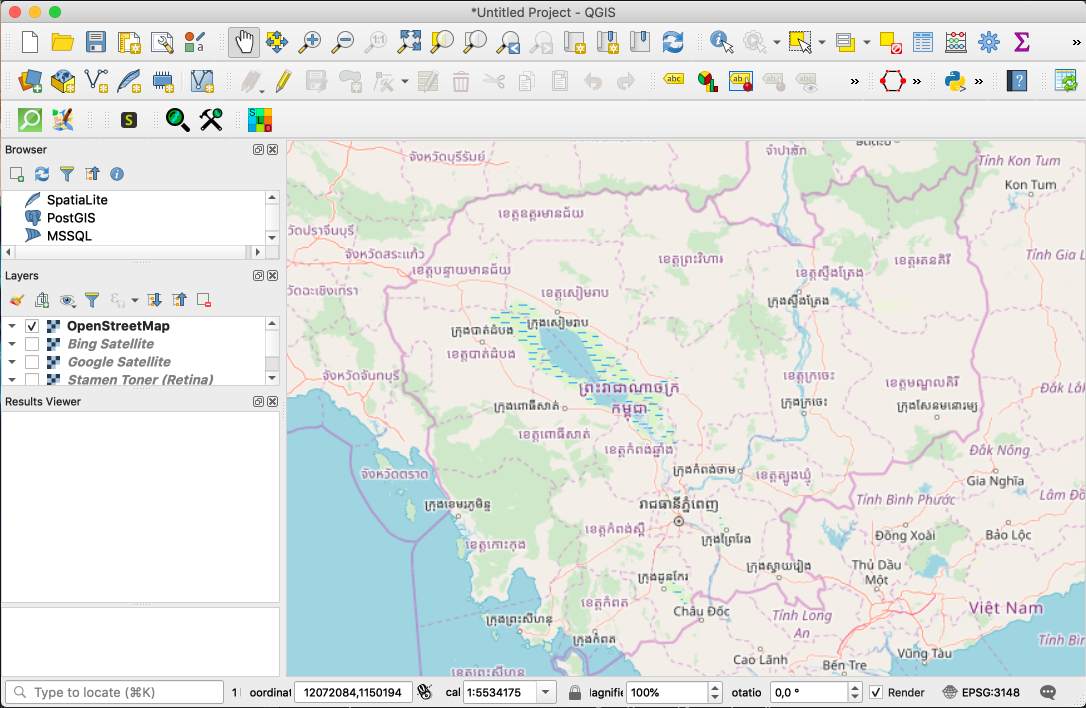
OpenStreetMap basemap
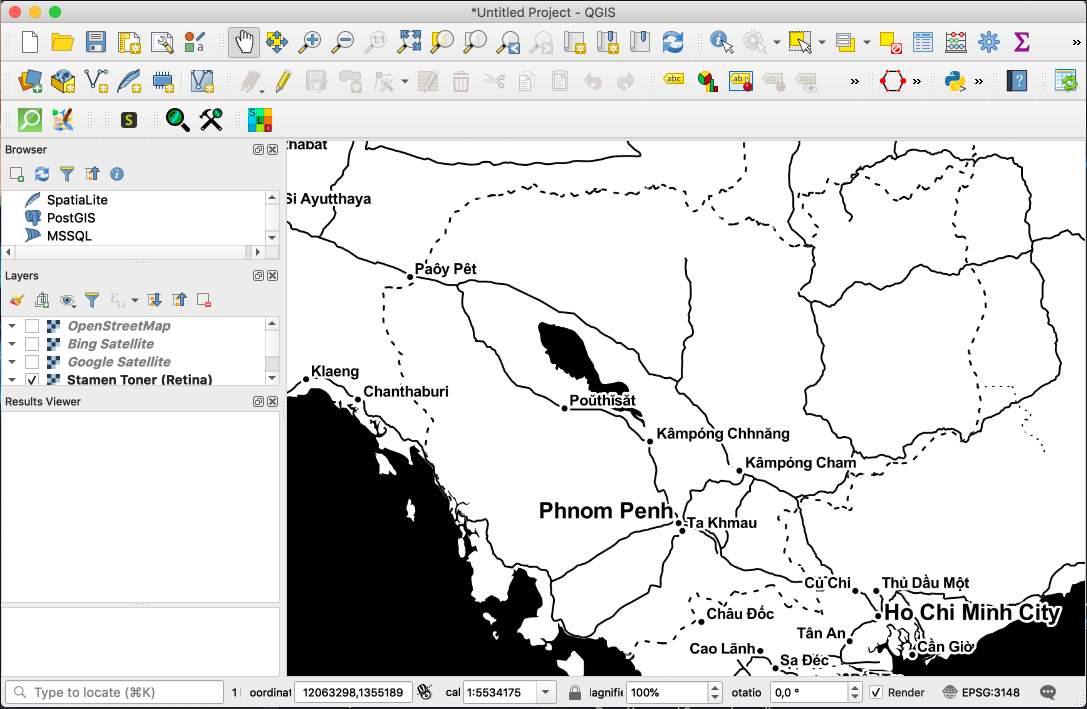
Stamen Toner basemap
There are several ways to add basemaps to QGIS:
- By using the Browser panel:
- In the Browser panel, go to XYZ Tiles and double click on OpenStreetMap
- By using a dedicated plugin:
You can also get a large list of basemaps using the QuickMapServices plugin:
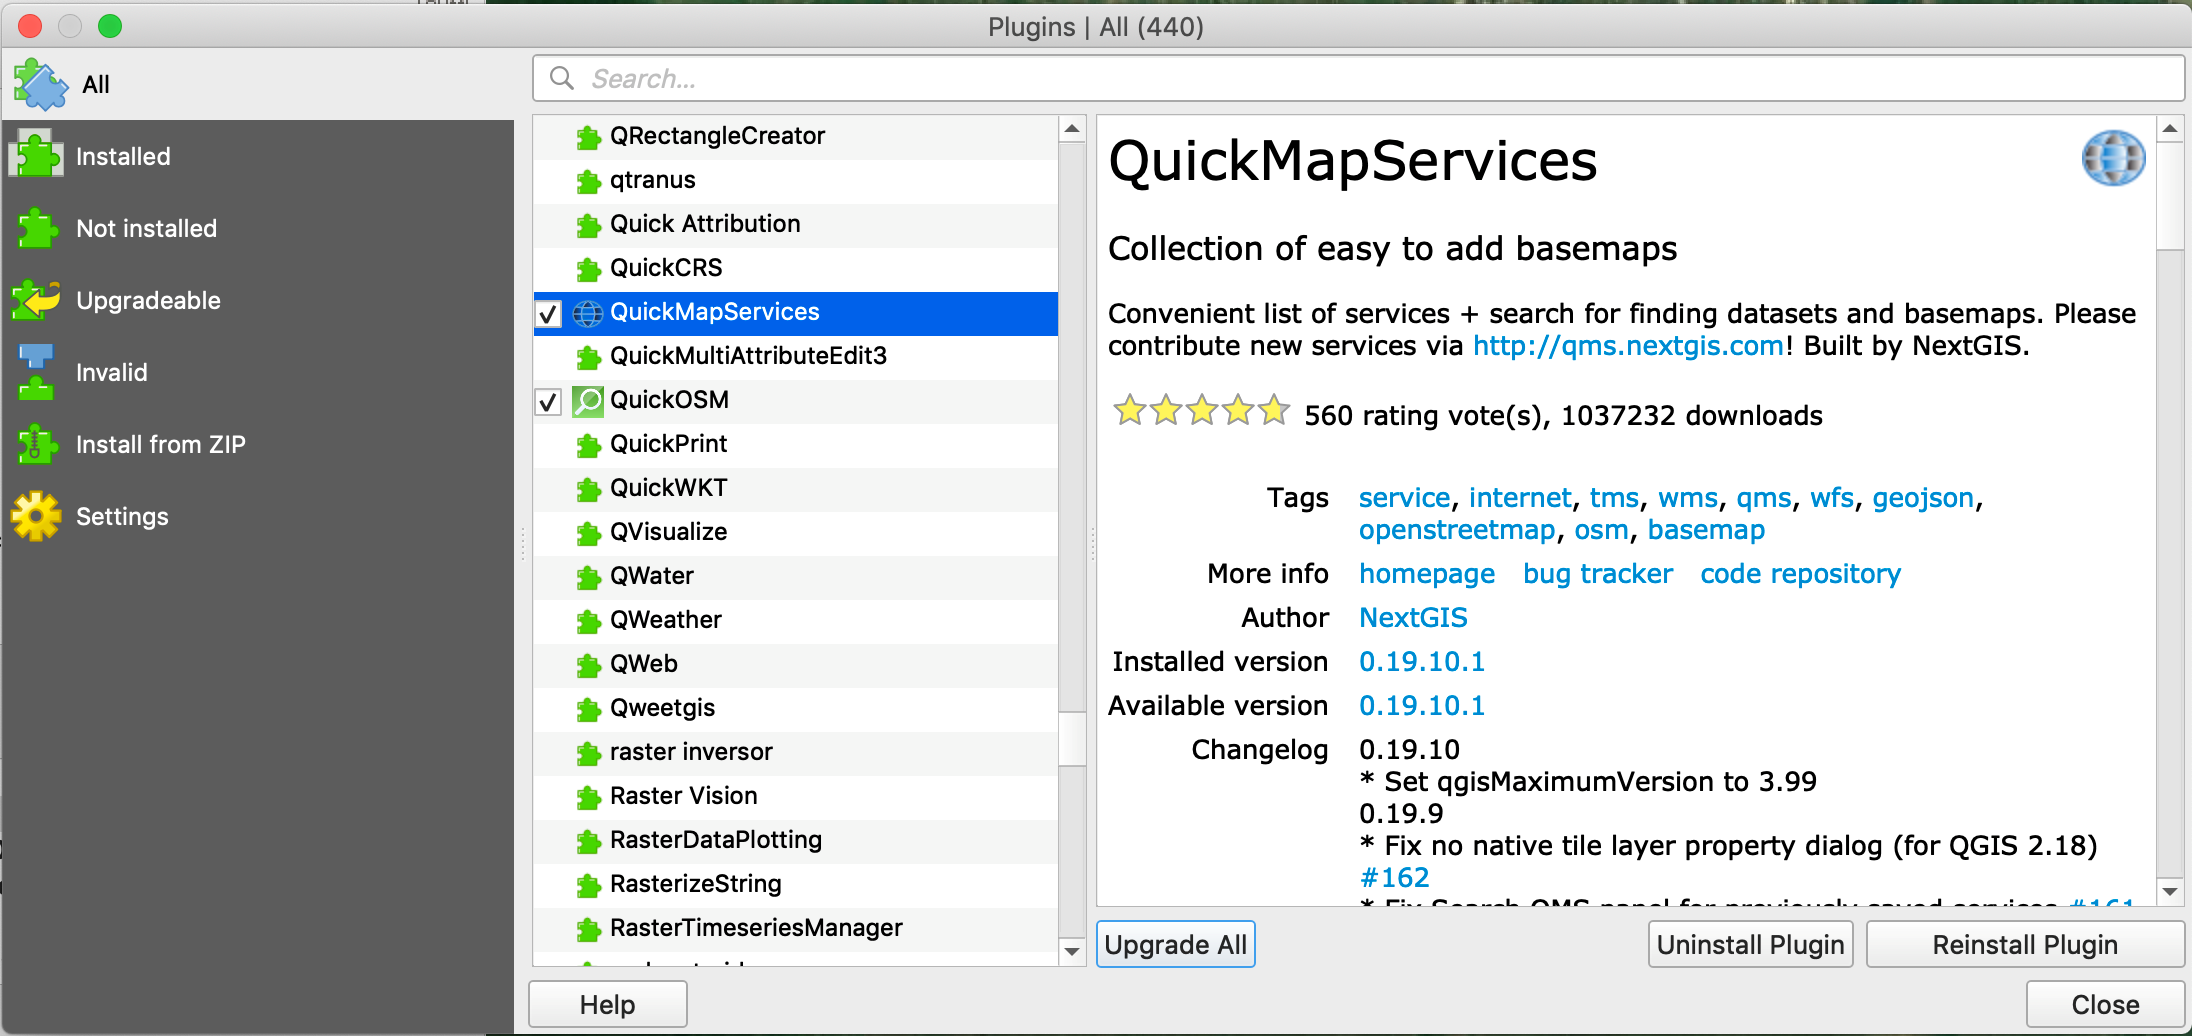
- Install QuickMapServices plugin by opening the Plugin Manager
- Menu Plugins / Install and Manage Plugins…
- Search for QuickMapServices (you can type “Quick” in the Search window)
-> this plugin will be installed in the Web Menu
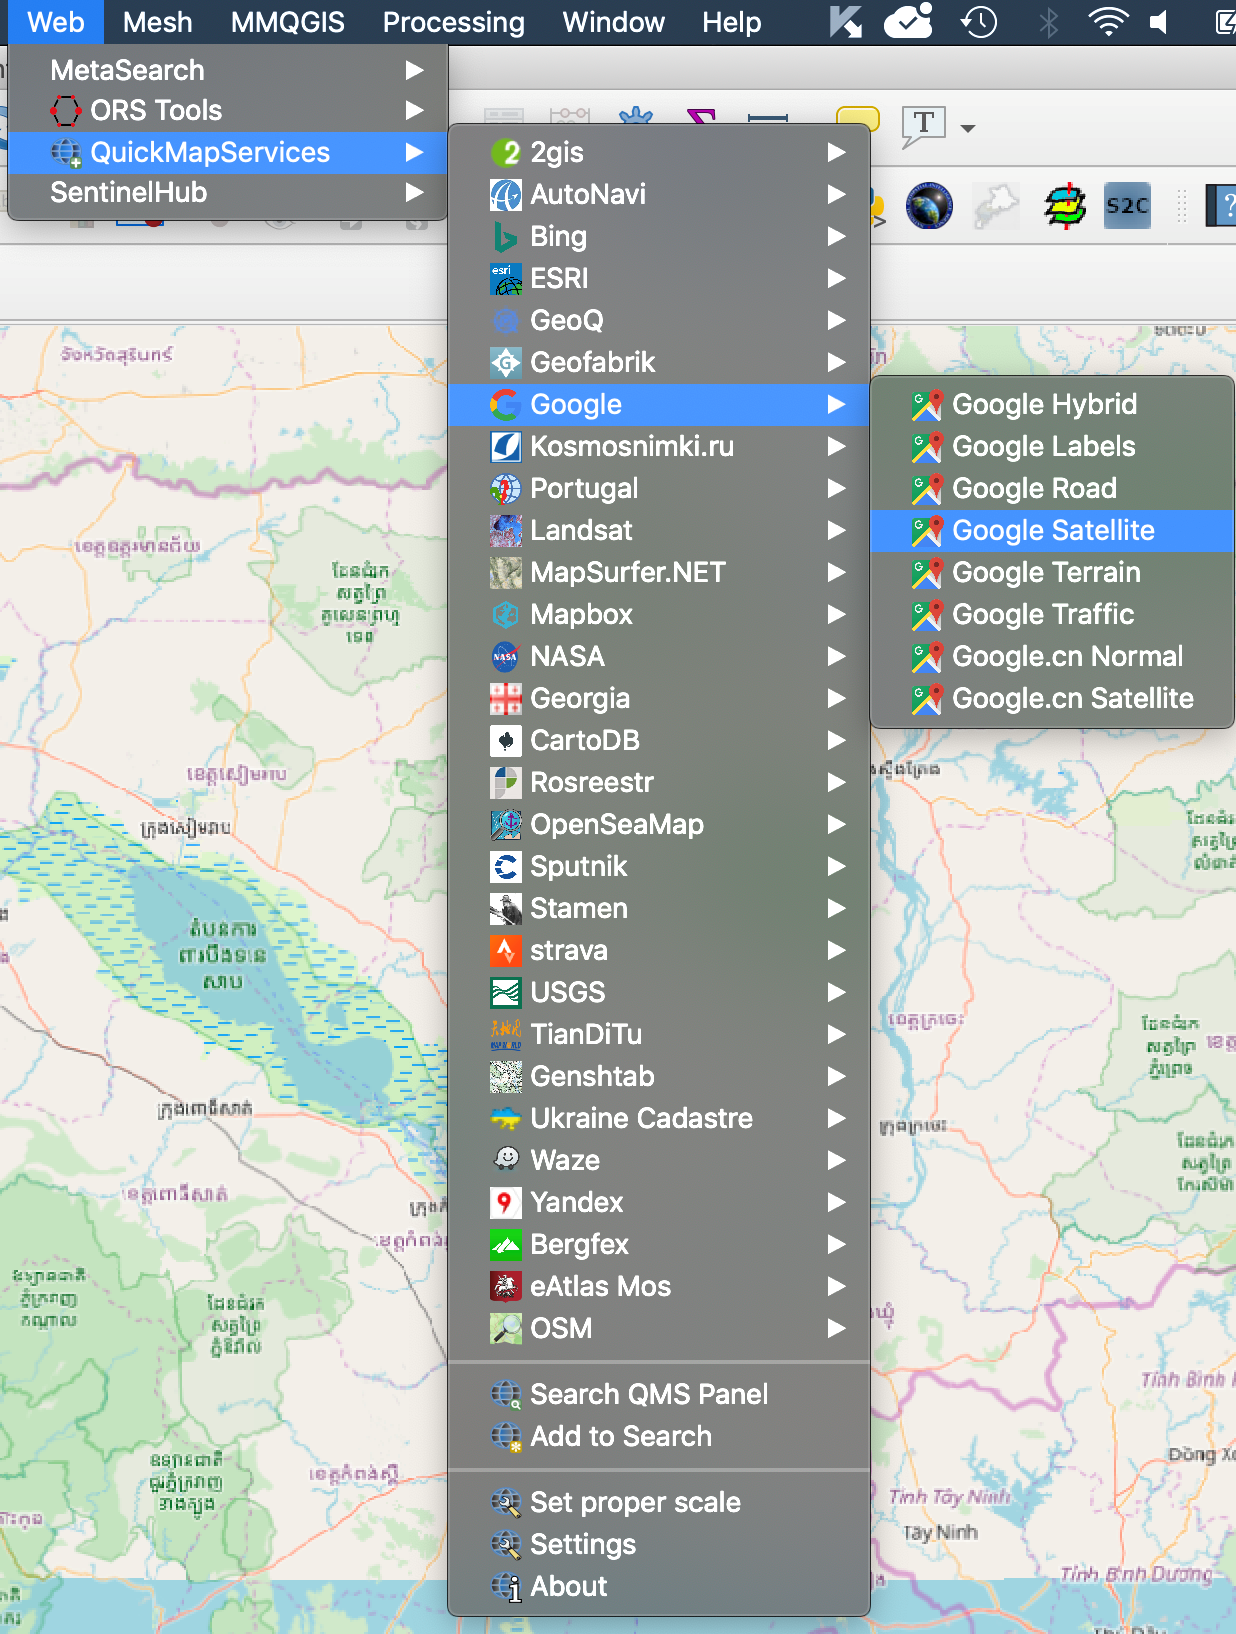
- Go to Menu Web / QuickMapServices
- Select the basemap you would like to display
QuickMap Services Plugin offers also precise settings for the visibility of the maps in the plugin, for getting more maps or for the download timeout.
- In the QuickMapServices Menu, go to Settings
- Go to the More Services tab
- Click on “Get contributed pack” to obtain more maps
Note: do not open too many basemaps since it will require internet
Alternatively, you can use the OpenLayers Plugin that will be also installed in the Web Menu but it offers less possibilities.
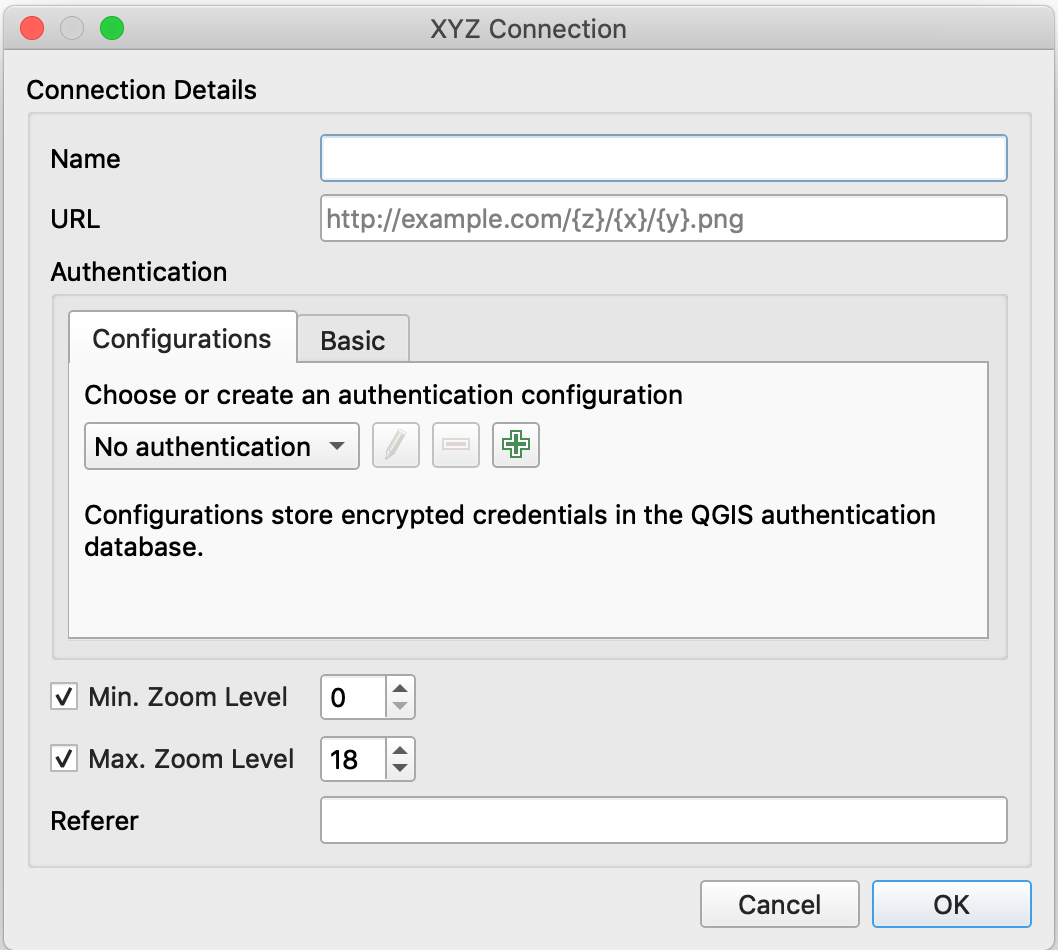
It is possible to add more basemaps in the XYZ Tiles Browser by connecting to other tile services
See: https://opengislab.com/blog/2018/4/15/add-basemaps-in-qgis-30
- Right-click on XYZ Tiles in the Browser Panel
- Select New Connection…
- Enter the name and URL of basemap
Example for Google Satellite: https://mt1.google.com/vt/lyrs=s&x=%7Bx%7D&y=%7By%7D&z=%7Bz%7D
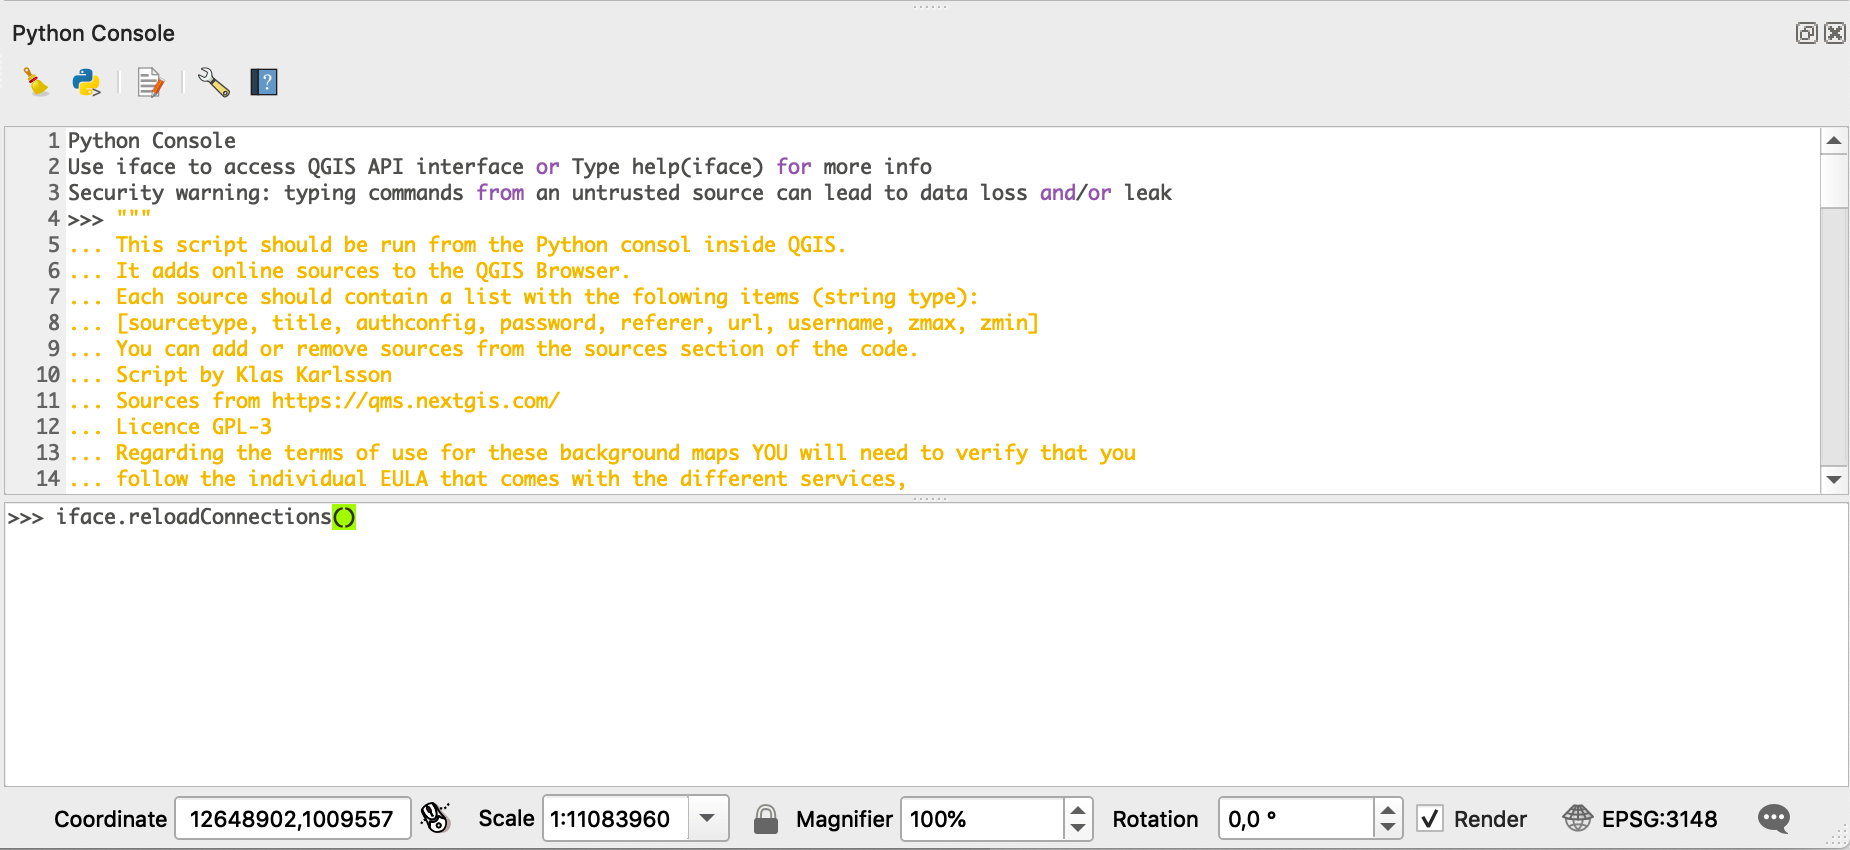
There is also the possibility to use a Python script to directly add several basemaps to the Browser:
- Copy the script here: https://raw.githubusercontent.com/klakar/QGIS_resources/master/collections/Geosupportsystem/python/qgis_basemaps.py
- Open the Python Console in the Plugins Menu / Python Console
- Paste the script and Run Python
- It will automatically update the liste of XYZ tiles (Thanks to the contributors of this nice Python script!).
2.5 Moving around the map
Map Navigation toolbar ![]()
Test the different tools:
- Pan map,
- Pan map to selection,
- Zooming: Zoom In, Zoom Out, Zoom to Native Resolution, Zoom Full, Zoom to Selection, Zoom to Layer, Zoom Last, Zoom Next,
- Refresh
Control the scale and the geographic coordinates of the map:
A specific scale can be given on the bottom right side of the window. ![]()
Also you can visualize the coordinates of the location of the mouse over the main window.![]()
2.6 Selecting and getting information on attributes
Attribute toolbar ![]()
Test the different tools:
- Identify features: First select a layer in the Layer Panel and then click on the object to display its information.
- Select Features: First select a layer in the Layer Panel, then choose between:
- Select Feature(s),
- Select Features by Polygon / by Freehand / by Radius
- Select Features by Value
- Deselect Features from all layers.
- Open Attribute Table: First select a layer in the Layer Panel and then click on this icon to display its table.
- Open Field Calculator
- Open Processing Toolbox
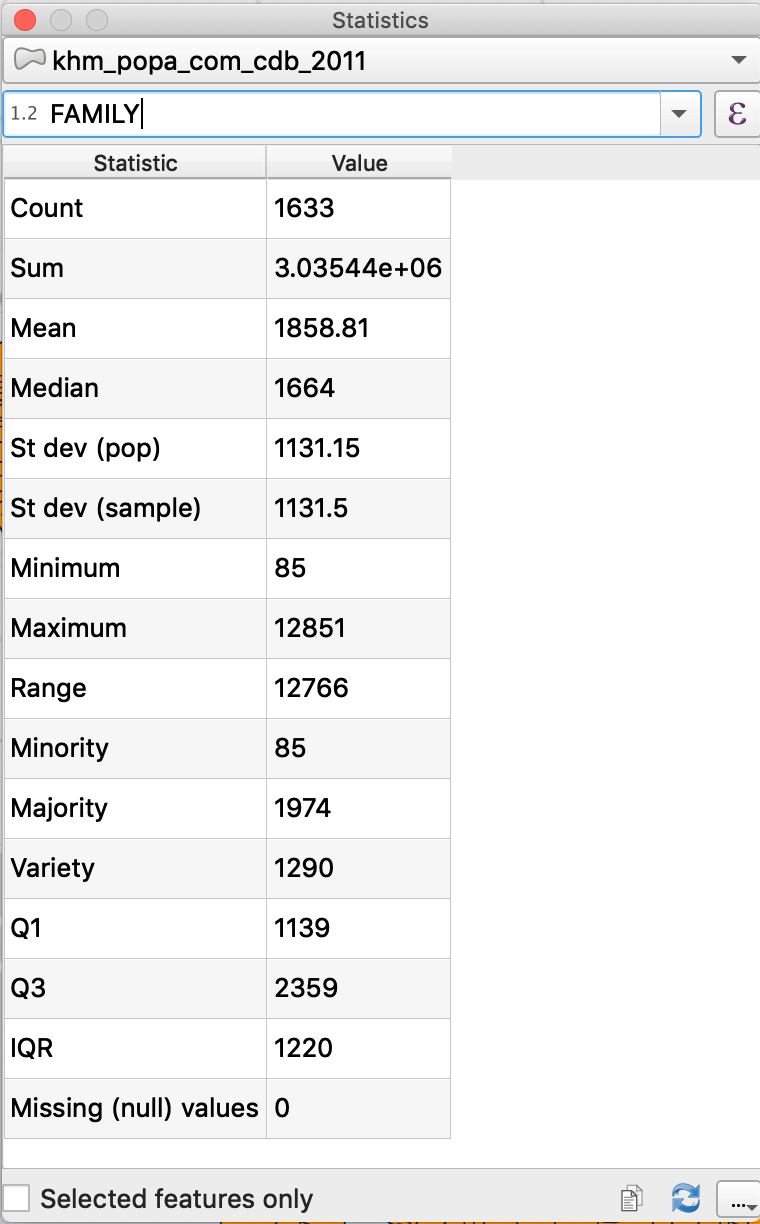
- Show Statistical summary
- Measure Line / Area / Angle
- Show Map Tips
- New Bookmark
- Show Bookmark
- Annotation: Text / Form / HTML / SVG / Move.
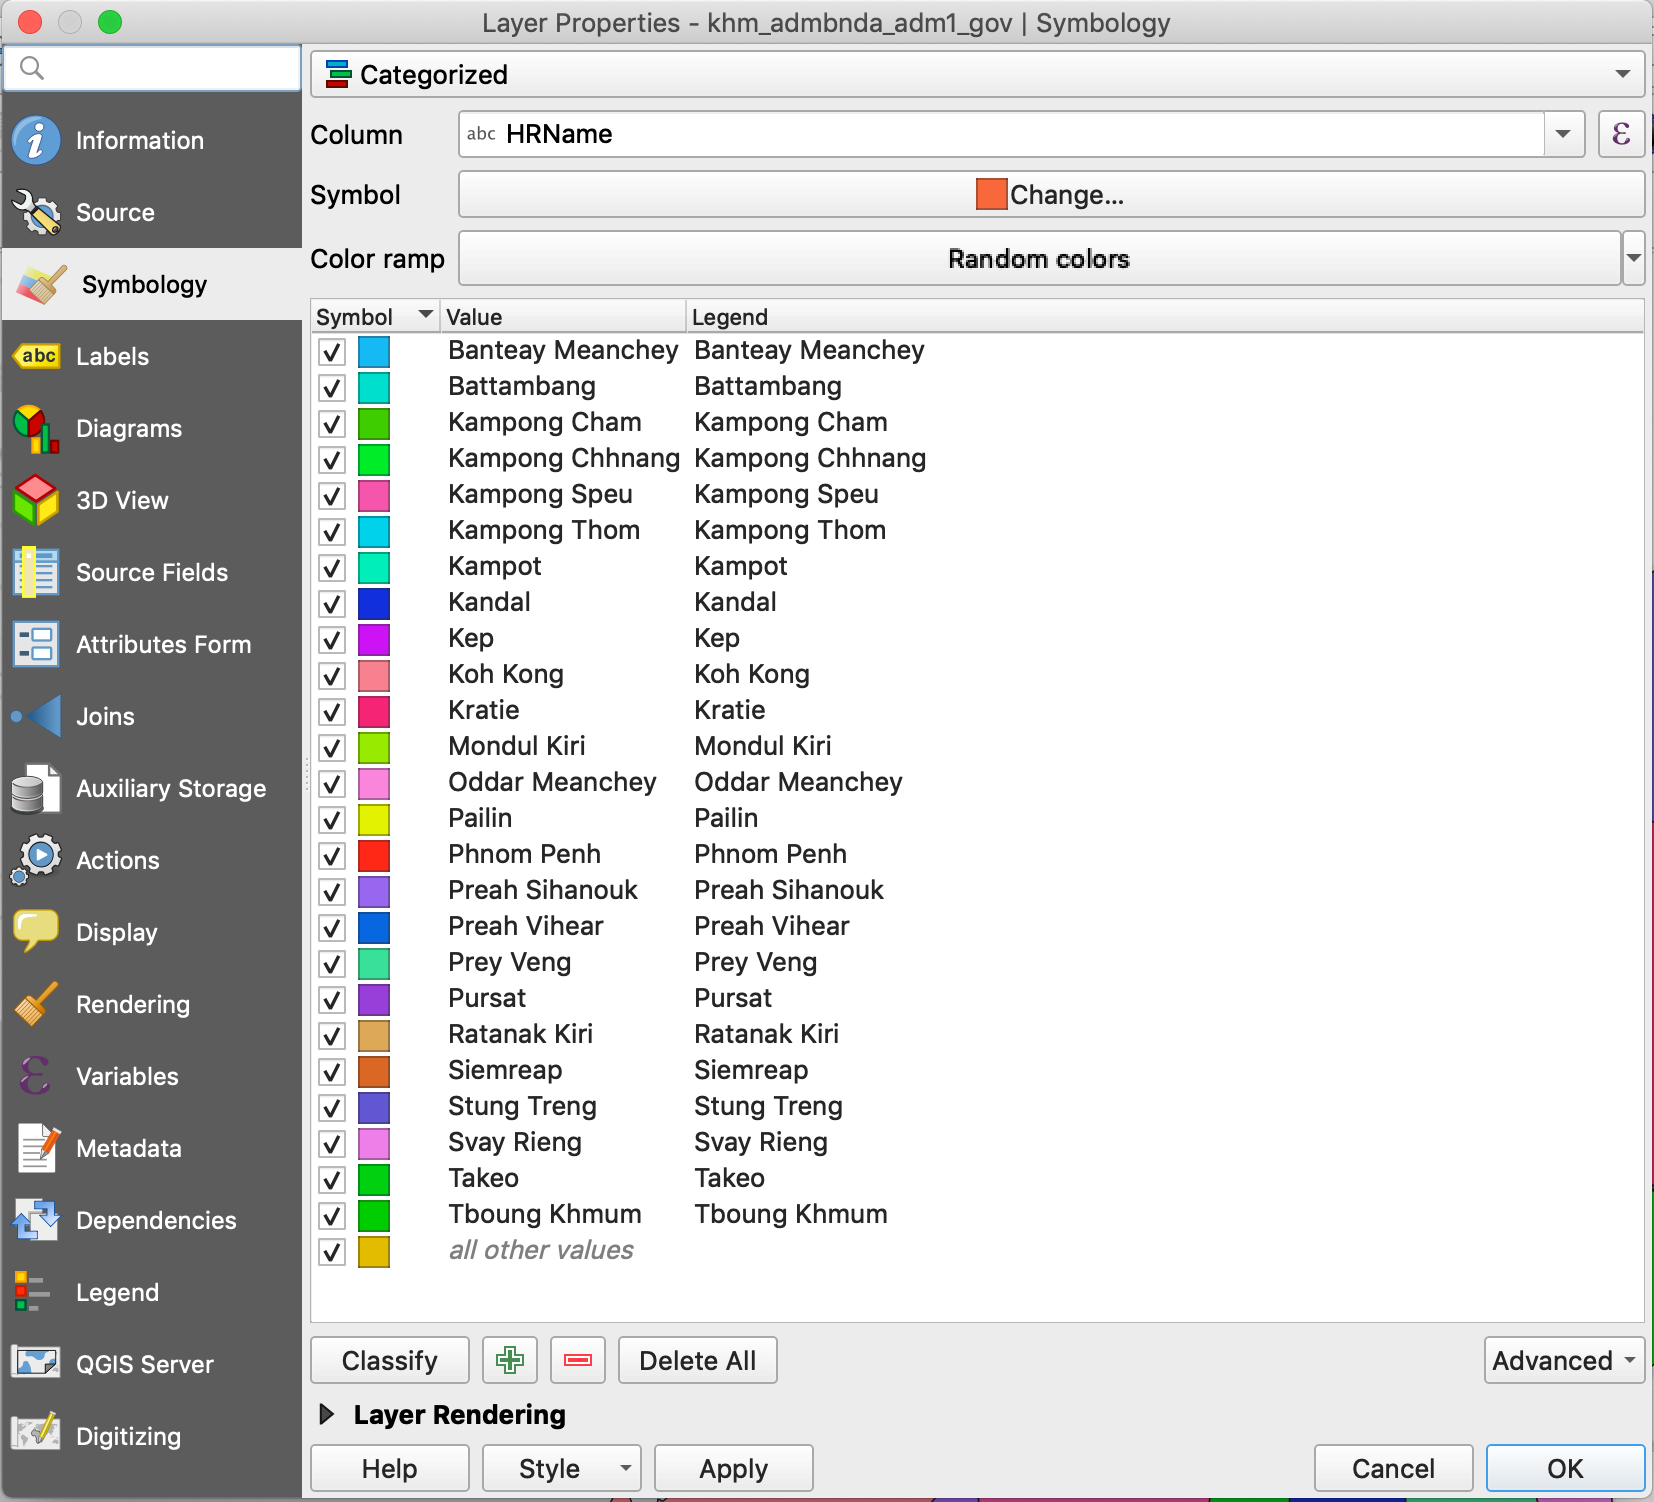
2.7 Adjusting the symbology
- Choose khm_admbnda_adm1_gov_20181004.shp
- Double click on the name of the layer to open the Layer properties window
- Choose the Symbology tab
- Here you will be able to select Single symbol / Categorized / Graduated / Rule-based / Point displacement
- Choose Categorized, choose the HRName column and click on Classify
- See the different options, with colors, and layer rendering
Alternatively, you can open the Layer Styling Panel with the shortcut in the top of the Layers Panel.
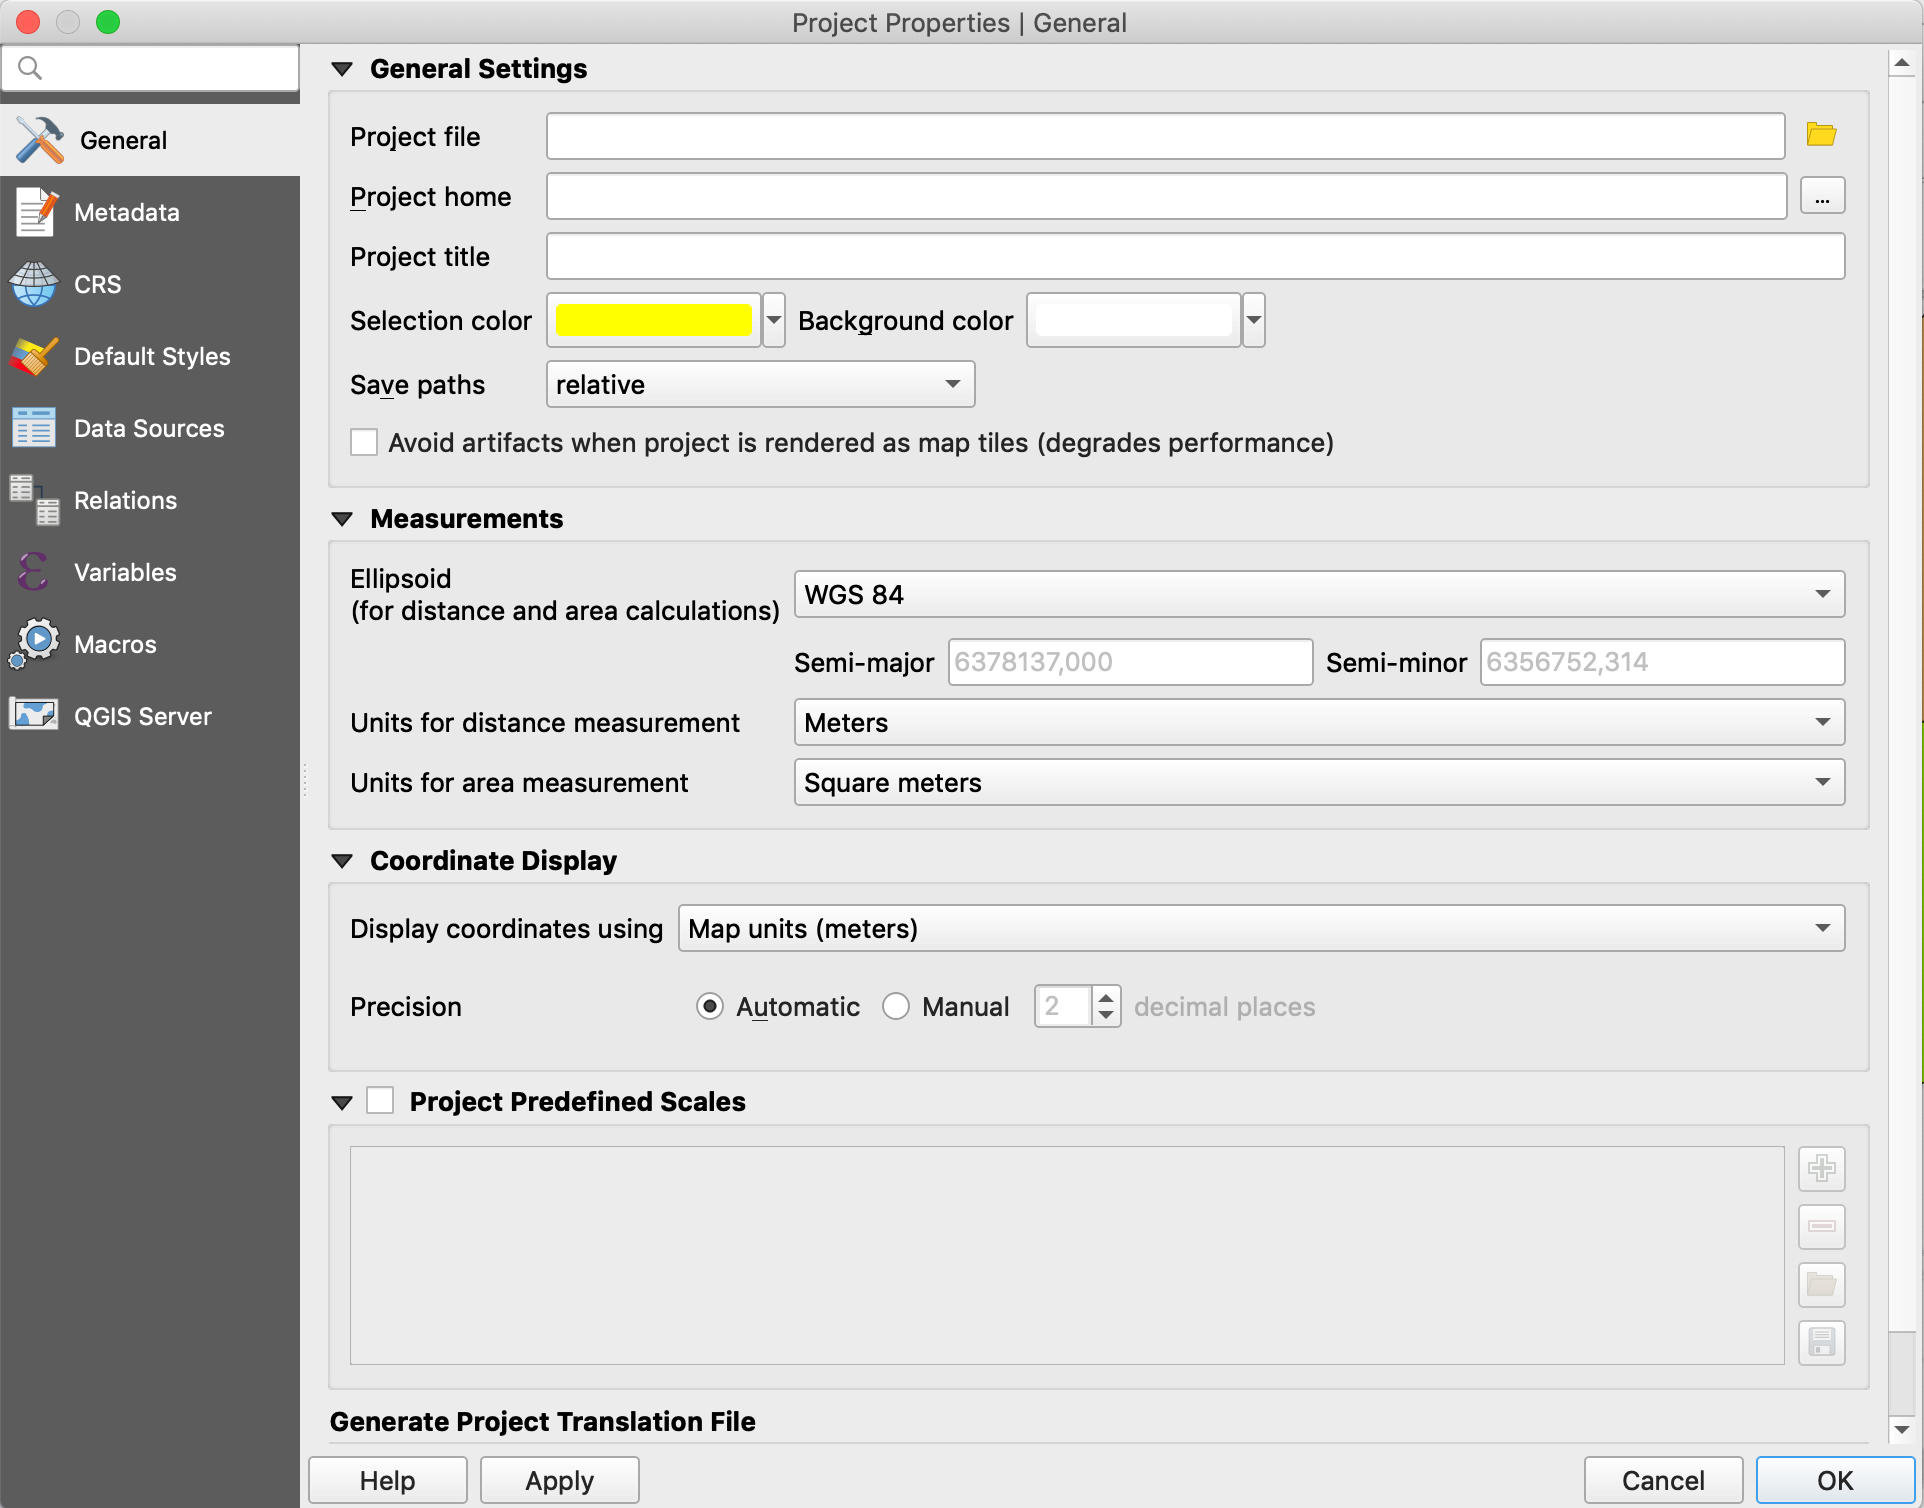
2.8 Choosing layer units
You may like to display your map either in “Degrees, Minutes, Seconds”, in “Decimal degrees” or in Meters.
- Go to Project / Properties / Tab General
2.9 Using Projections
QGIS allows to define a Coordinate Reference System (CRS) by default or for the whole project, for layers without predefined CRS. It also allows to define customized CRS and allows the projection of vector layers on the fly.

Notes: Layers should be in the same CRS to allow geoprocessing. Indeed, we will have to check and pay attention to the CRS of each layer when using them for spatial analyses. However QGIS can display layers with different CRS on the same extent.
Layers should use a projection in meters, when calculating distances or buffers.
QGIS manages approximately 2,700 CRS.
For this training using data from Cambodia, we will use the following projections:
- Geographic CRS (in decimal degrees): WGS 84 (EPSG:4326)
-> This CRS has a worldwide coverage and is used for Google and OpenStreetMap data.
- Global projected CRS (in meters): WGS 84 / UTM zone 48N (EPSG:32648)
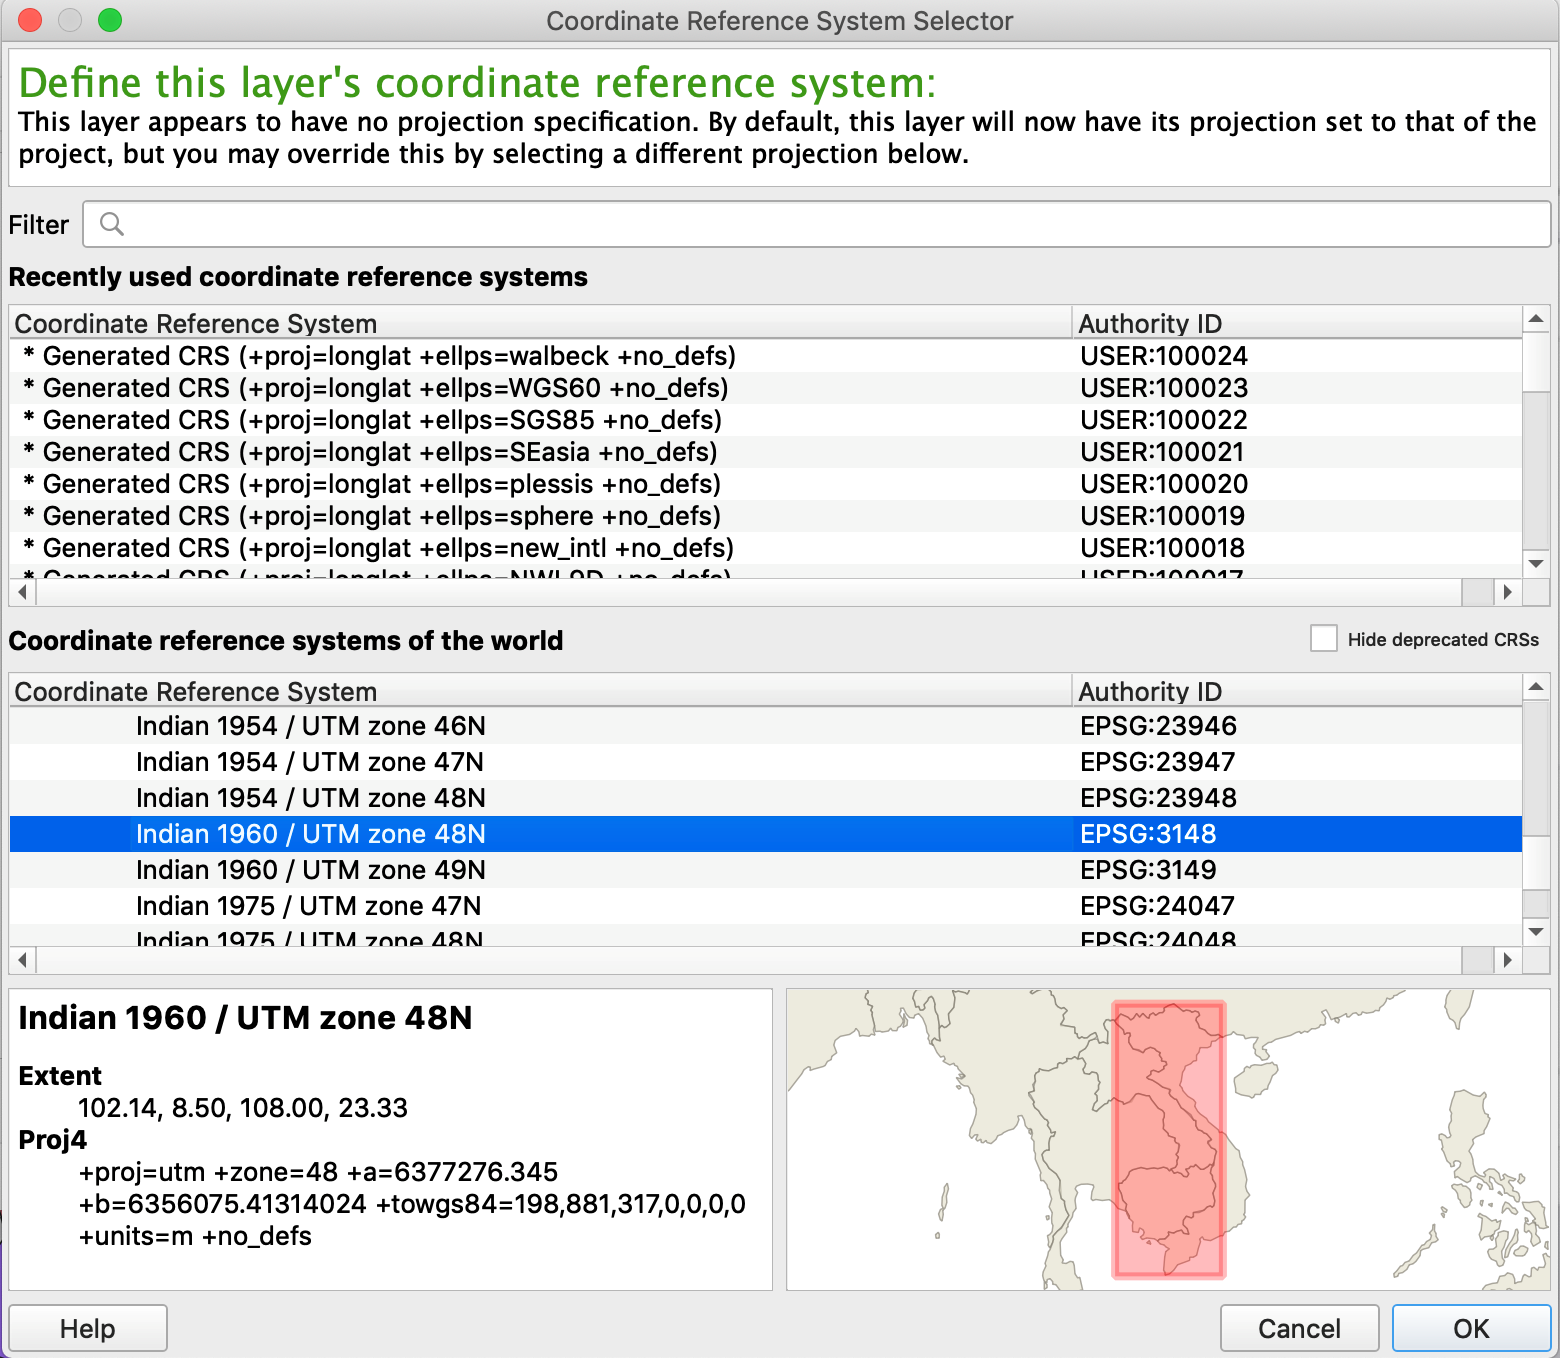
- Local projected CRS (in meters): Indian 60 / UTM zone 48N (EPSG:3148)
Specify the CRS of a layer:
- Double click on the name of the layer to open the Layer properties window
- Choose the Source tab
- Click on the Select CRS button
- Choose the desired projection from the top list if it appears among those recently used, otherwise from the bottom list.
- Use the filter if the desired projection does not appear in the top list.
- You can save the layer with a new projection: this is the way to reproject a layer.
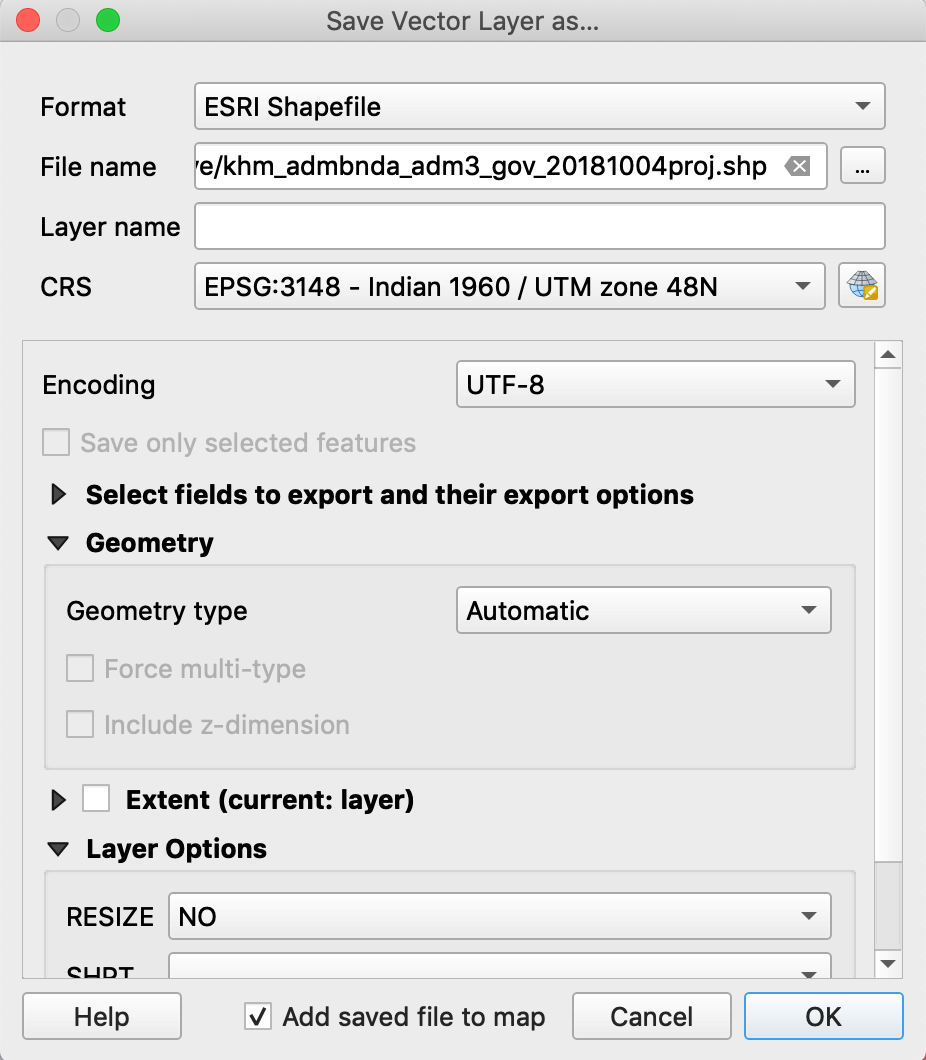
Exercise:
- Check the CRS of your administrative files (WGS 84).
- Reproject them into Local projected CRS (Indian 60 / UTM zone 48N):
- Right-click on the name of the layer
- Export / Save Features As…
- Browse to your folder and give a new name indicated they are reprojected.
- Choose the new CRS
- OK
Specify the SCR of a project:
- Go to Project / Properties
- Select the Coordinate Reference System (CRS) tab
- Choose the desired CRS