
4. Using Raster Data
In this exercise, we will use a Digital Elevation Model (DEM), called SRTM (Shuttle Radar Topography Mission), provided by NASA and NGA (formerly NIMA).
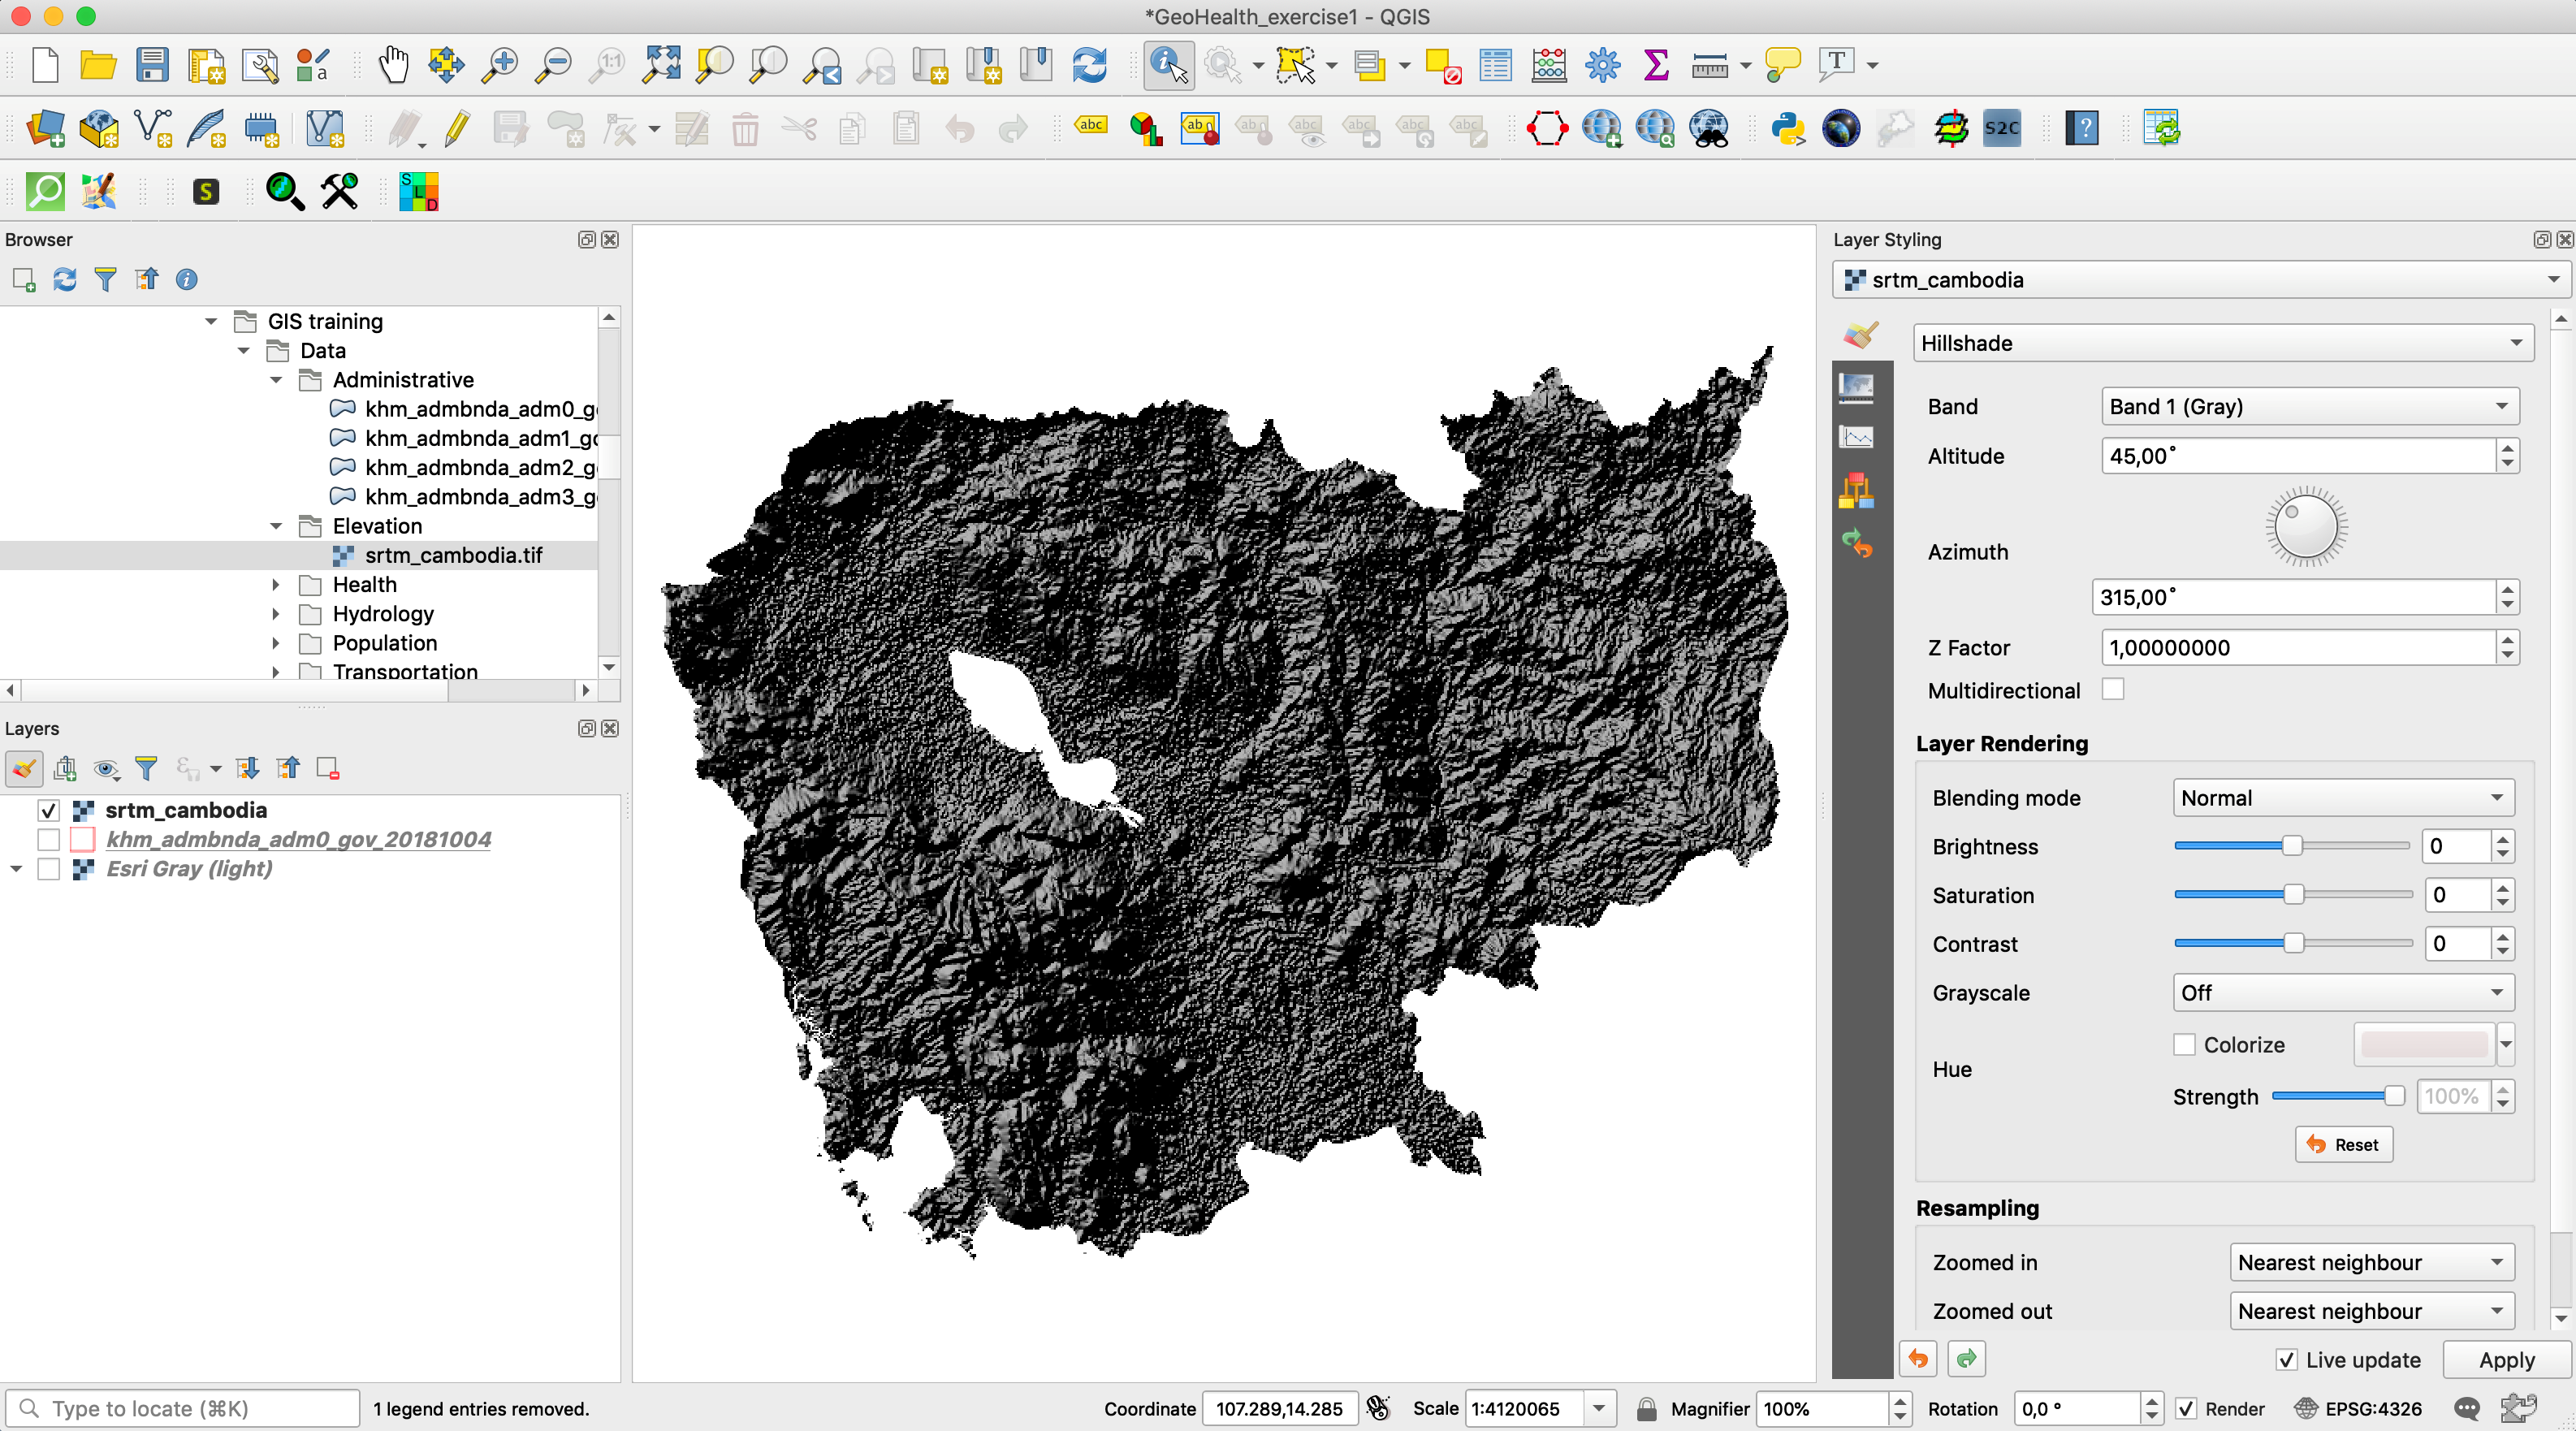
4.1 Opening and displaying raster data
- Open the Data Source Manager
 , choose the “Raster” tab and browse to srtm_cambodia.tif
 - Double-click on the name to open the Layer Properties, and go to the Symbology tab
- In Render type, choose “Hillshade” and Apply to view the Elevation data with shadow
- Try also the “Singleband pseudocolor” for a color view. You can adjust the classification mode and increase the number of classes. You can choose the color ramp and invert colors.
- Open the Data Source Manager
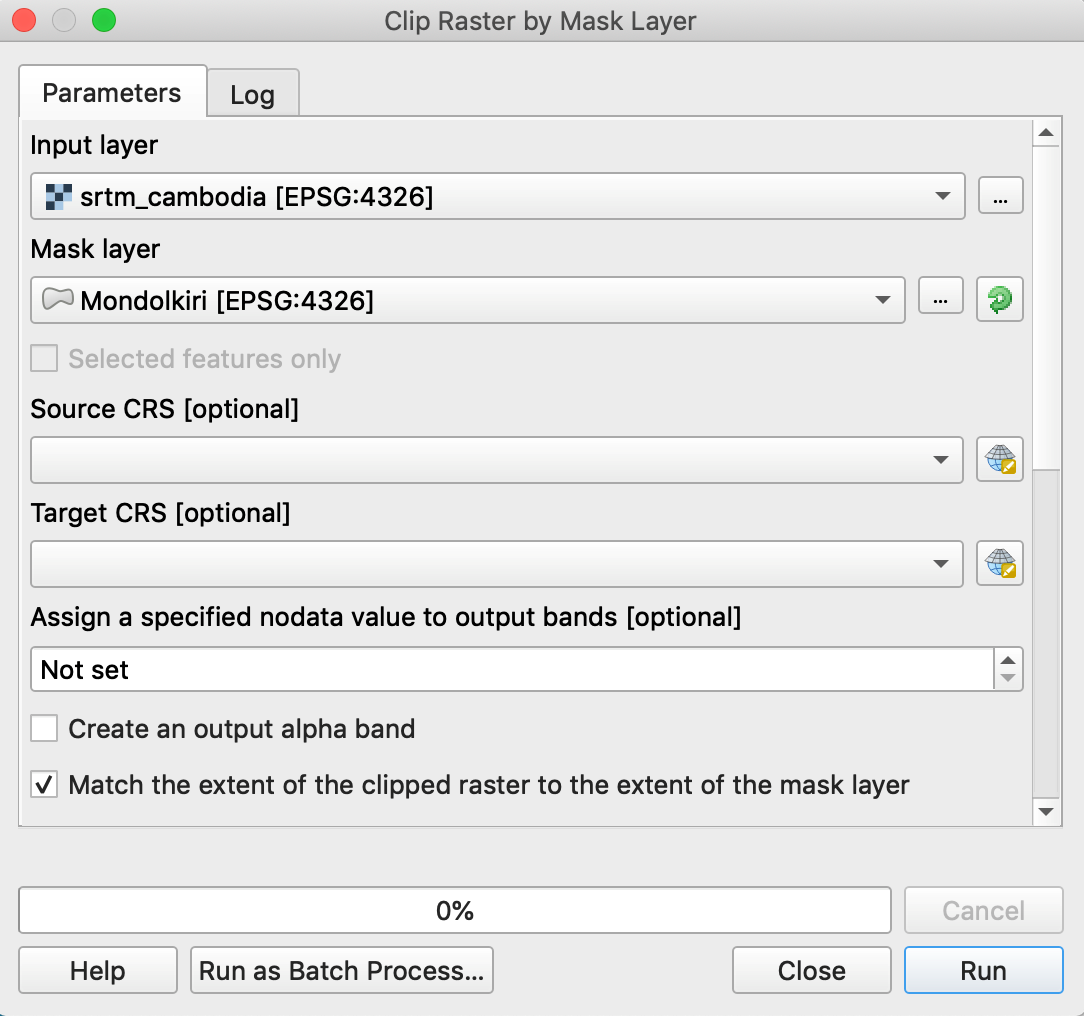
4.2 Clipping a raster data
QGIS offers the possibility to cut a raster according to the contour of vector layers.
Exercise: Extract the SRTM on Mondolkiri province (east of Cambodia)
- Create a shapefile layer of Mondolkiri
- Open the province layer: khm_admbnda_adm1_gov_20181004
- Select Mondolkiri province
- Right-click on the name of the layer / Export / Save Selected Features As…
- Browse to your folder and save the Mondolkiri.shp layer
- Raster / Extraction / Clip Raster by Mask Layer…
- Input layer = srtm_cambodia.tif
- Mask layer = Mondolkiri.shp
- Run
- Create a shapefile layer of Mondolkiri
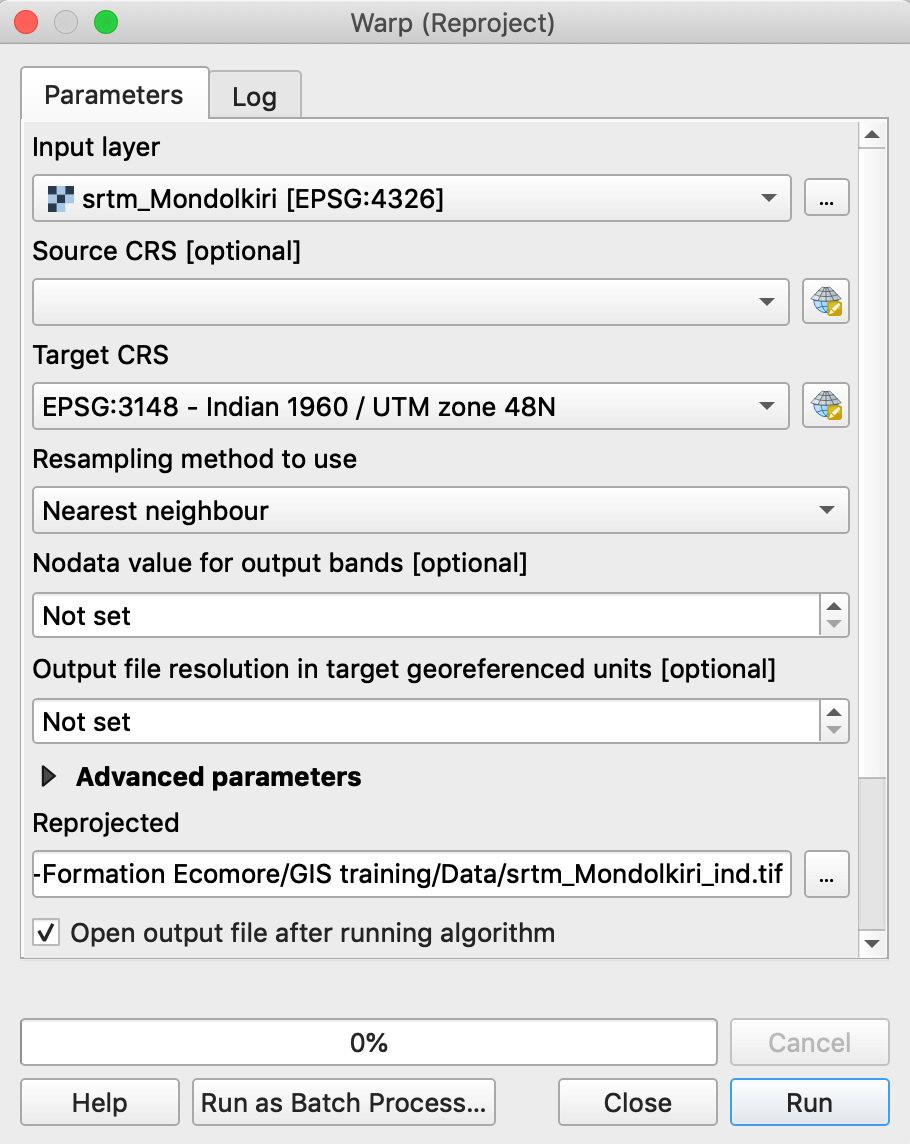
4.3 Changing the projection of a raster
The DEM srtm_cambodia.tif is in WGS84 with units in decimal degrees. To make some calculations related to distances, we will need the meter as a unit. It is therefore necessary to reproject our raster.
Exercise: Reproject the Mondlkiri DEM in the local projected CRS
- Go to Raster Menu / Projections / Warp (Reproject)
- Input layer = srtm_Mondkiri.tif
- Target CRS: choose the local projected CRS
- Browse to your folder and give a name to the Reprojected raster
4.4 Deriving information from DEM: slopes, aspect, hillshading, contours
Several tools are provided in the Analysis Menu from the Raster Menu
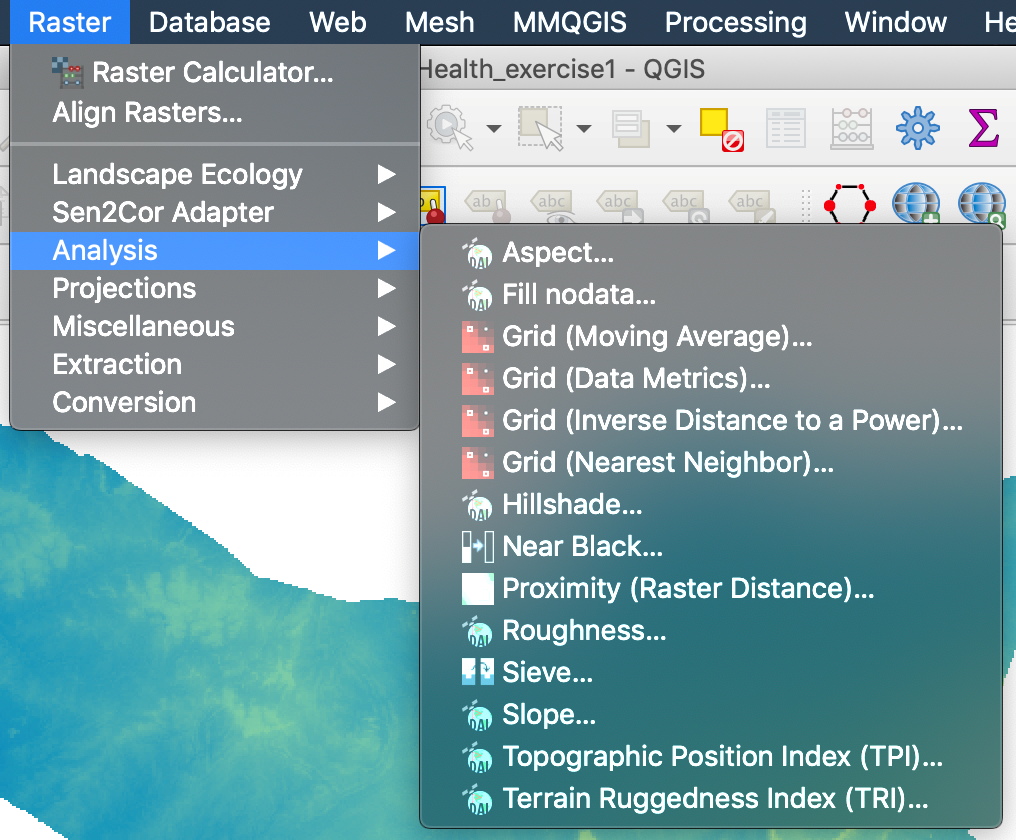
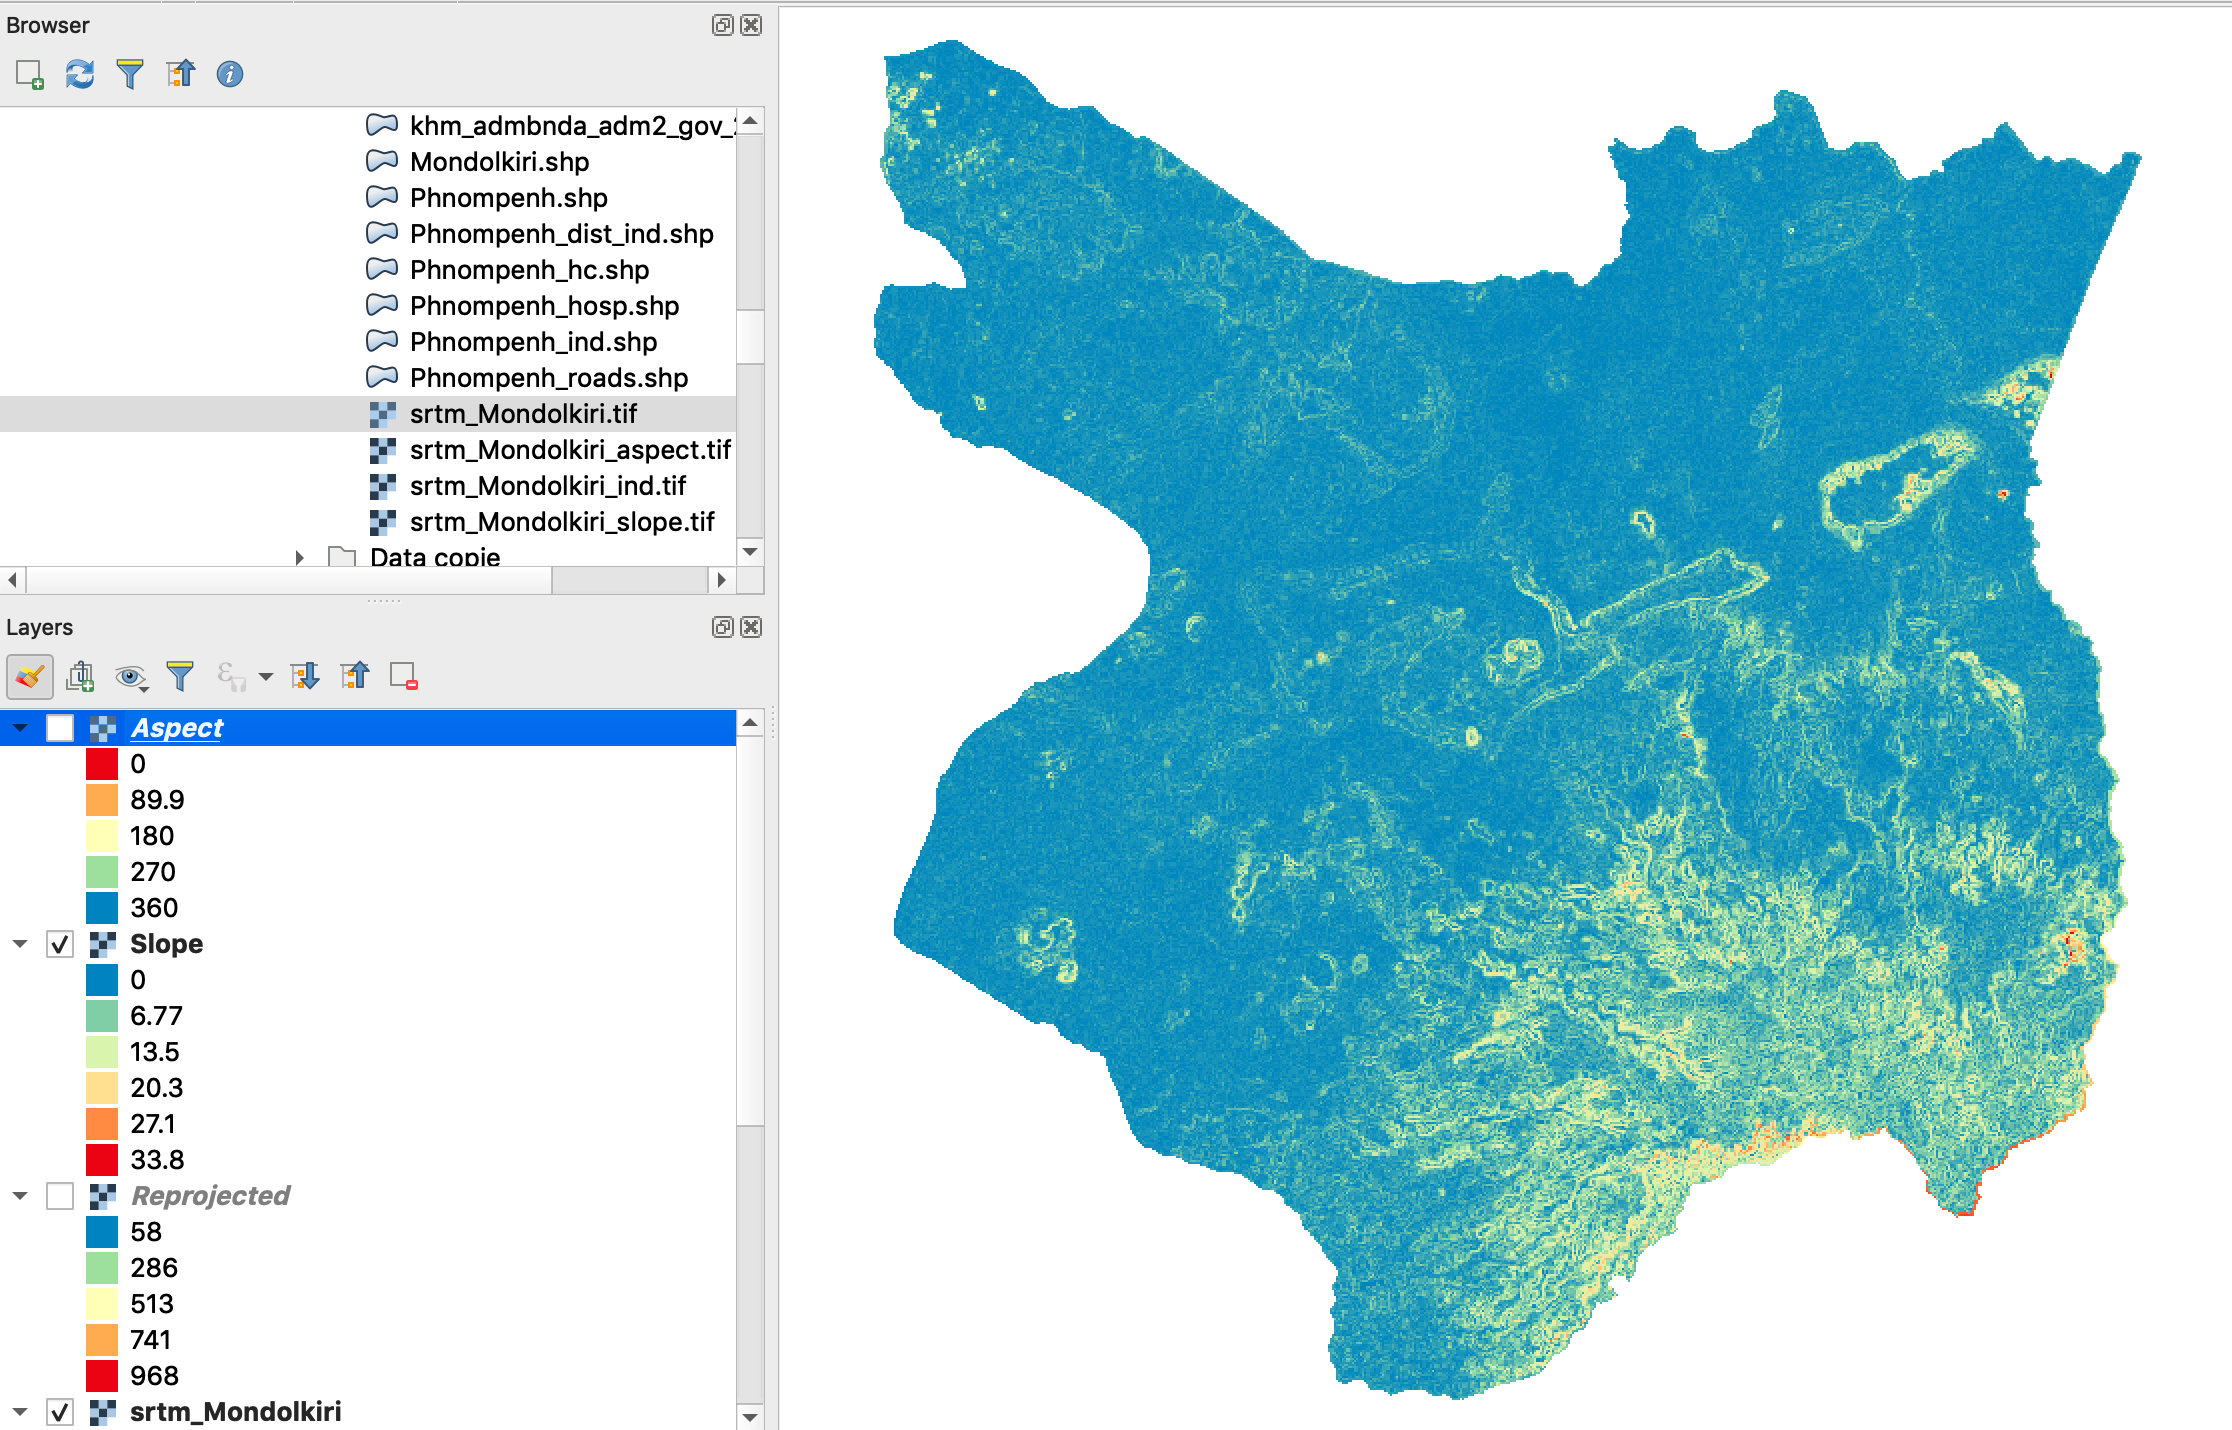
Exercise: Calculate slope and aspect in Mondolkiri province
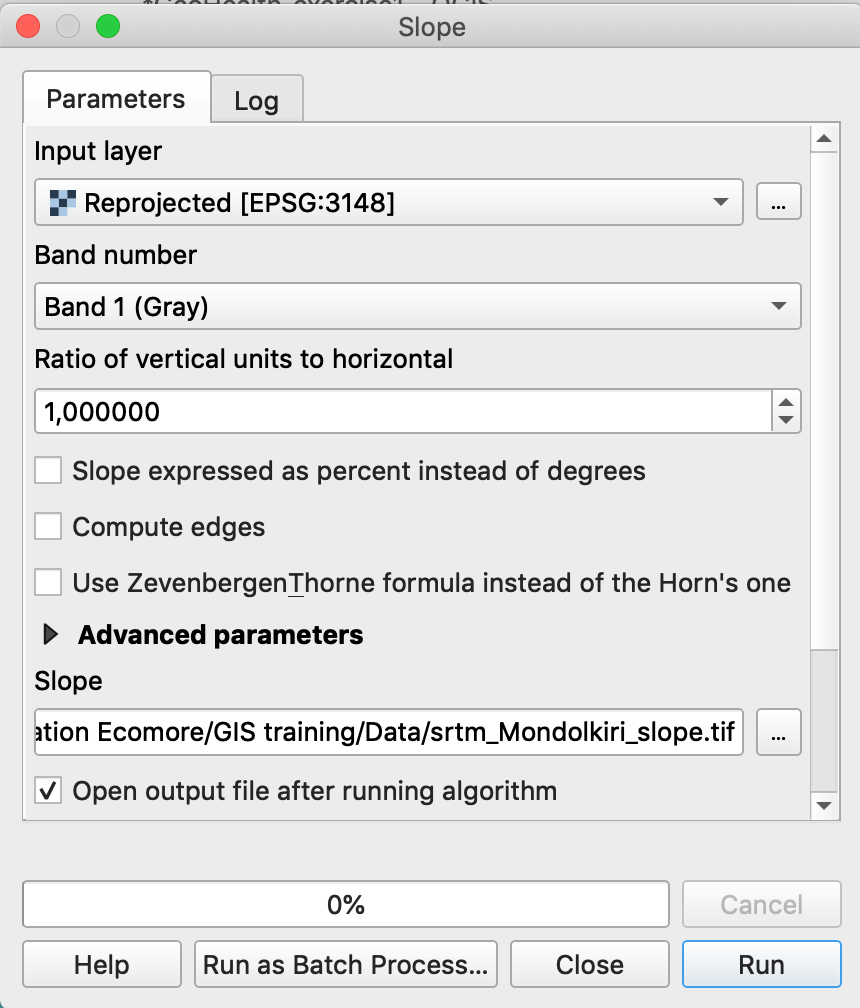
- Go to Raster Menu / Analysis / Slope…
- Choose the Mondolkiri DEM
- Browse to your folder and give a name to the raster of slopes
- Run
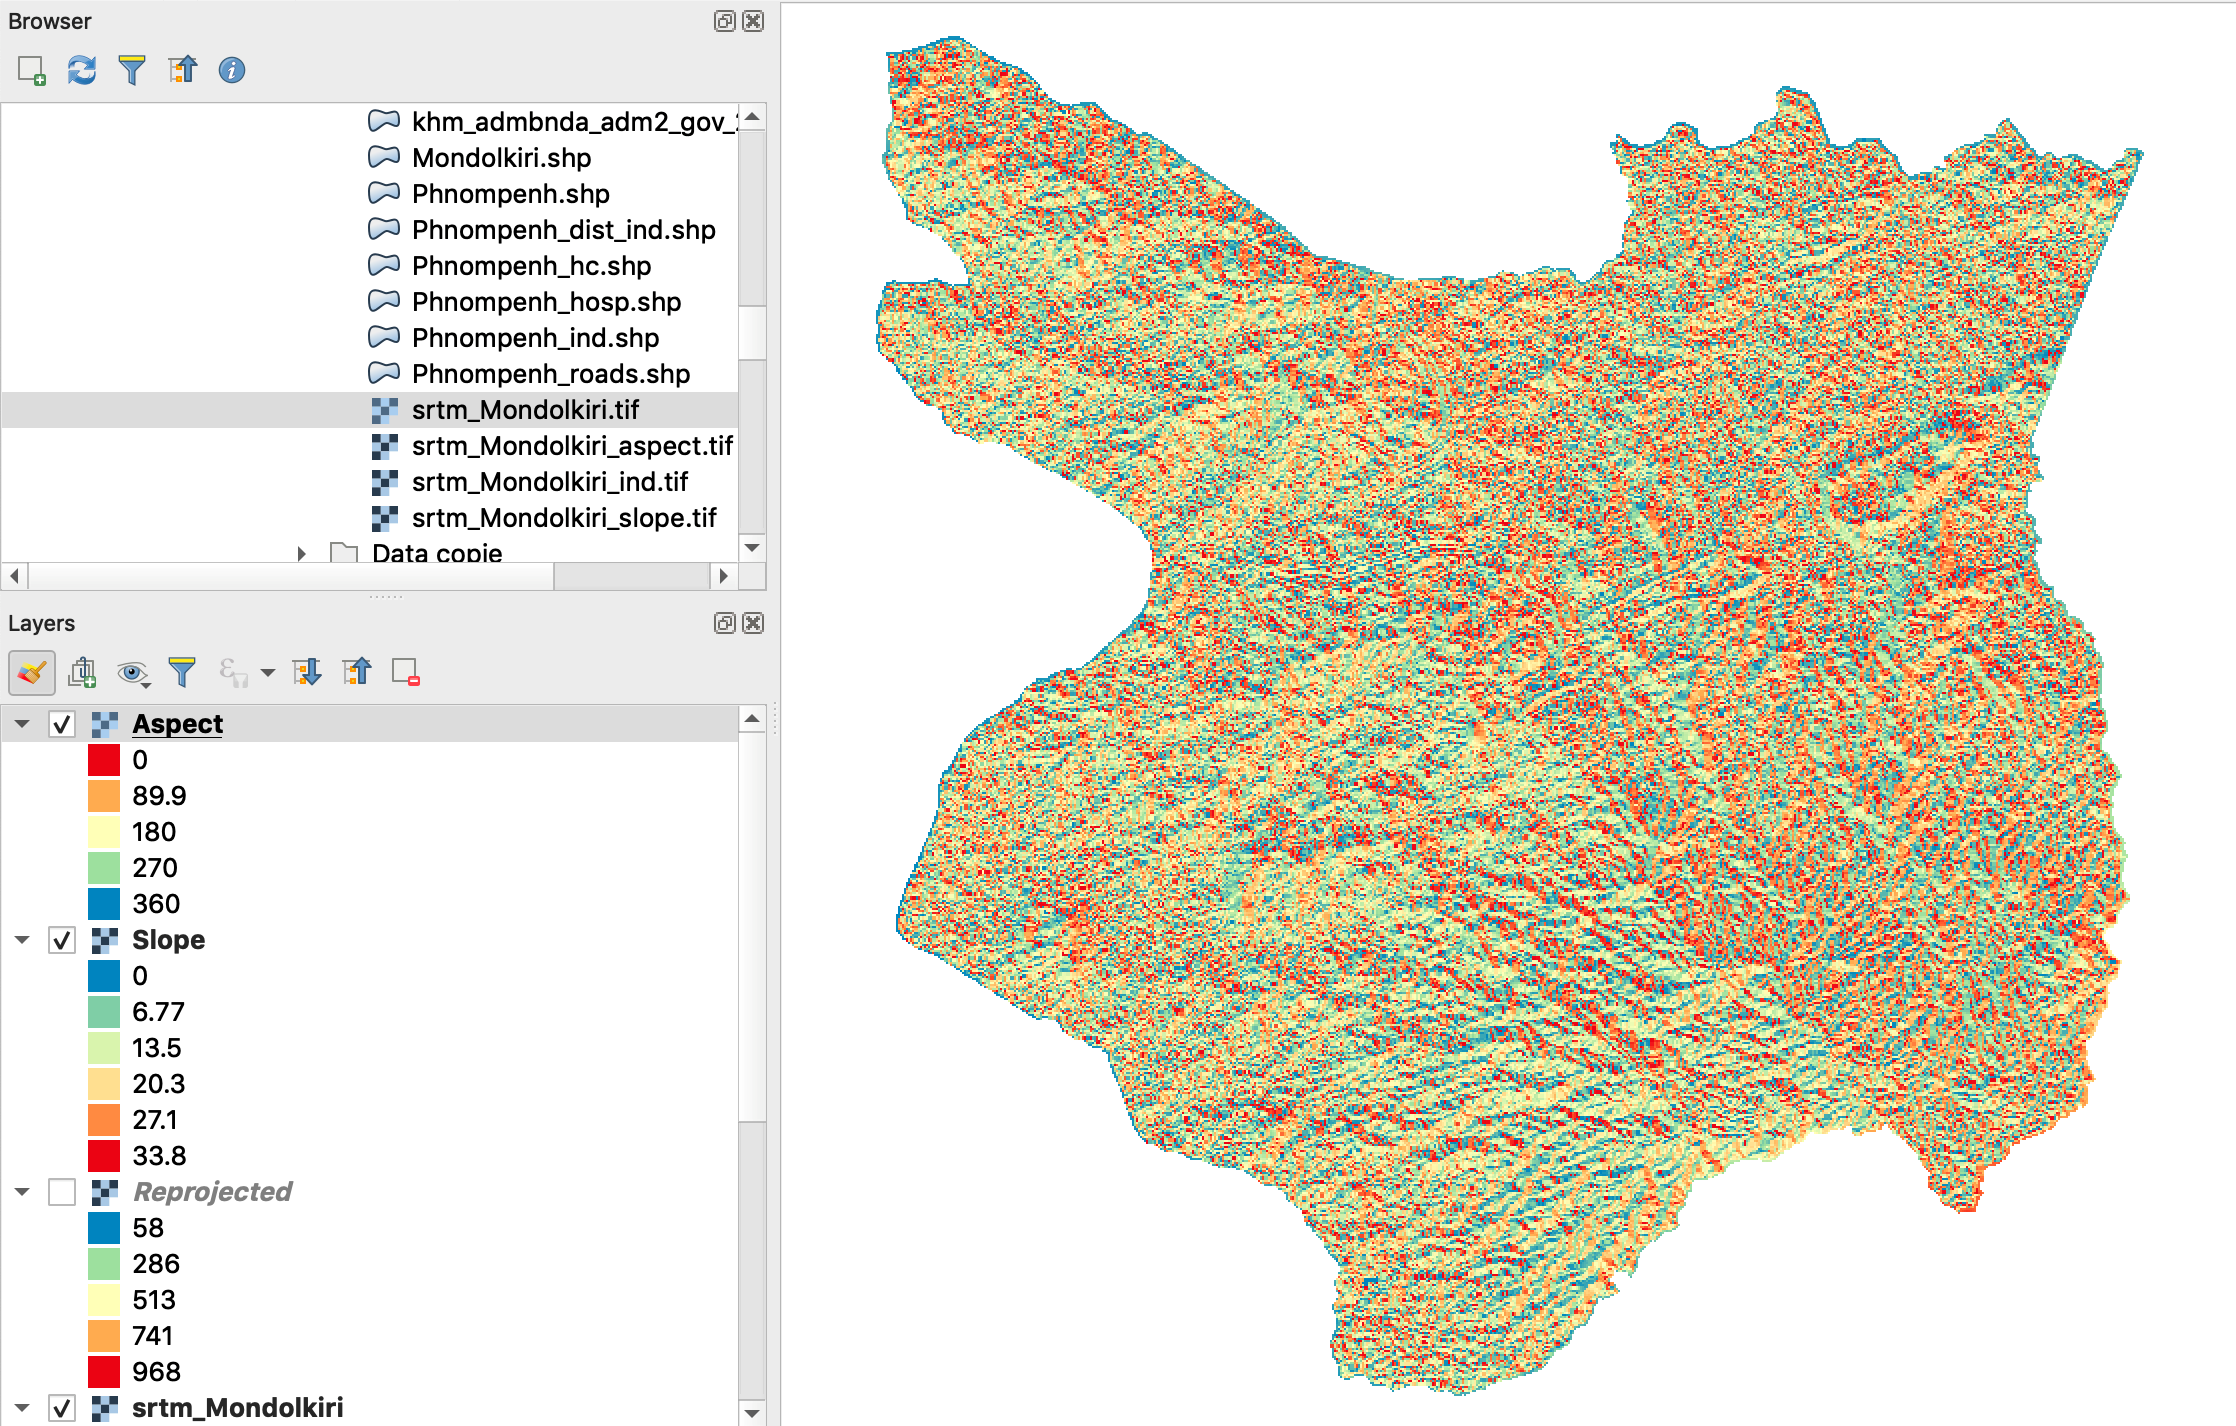
- The same applies to the calculation of exposure (aspect) and hillshading.
Note: Calculating the slope in QGIS is simple. The output is also a raster of the same resolution (90 meters) as the source raster.
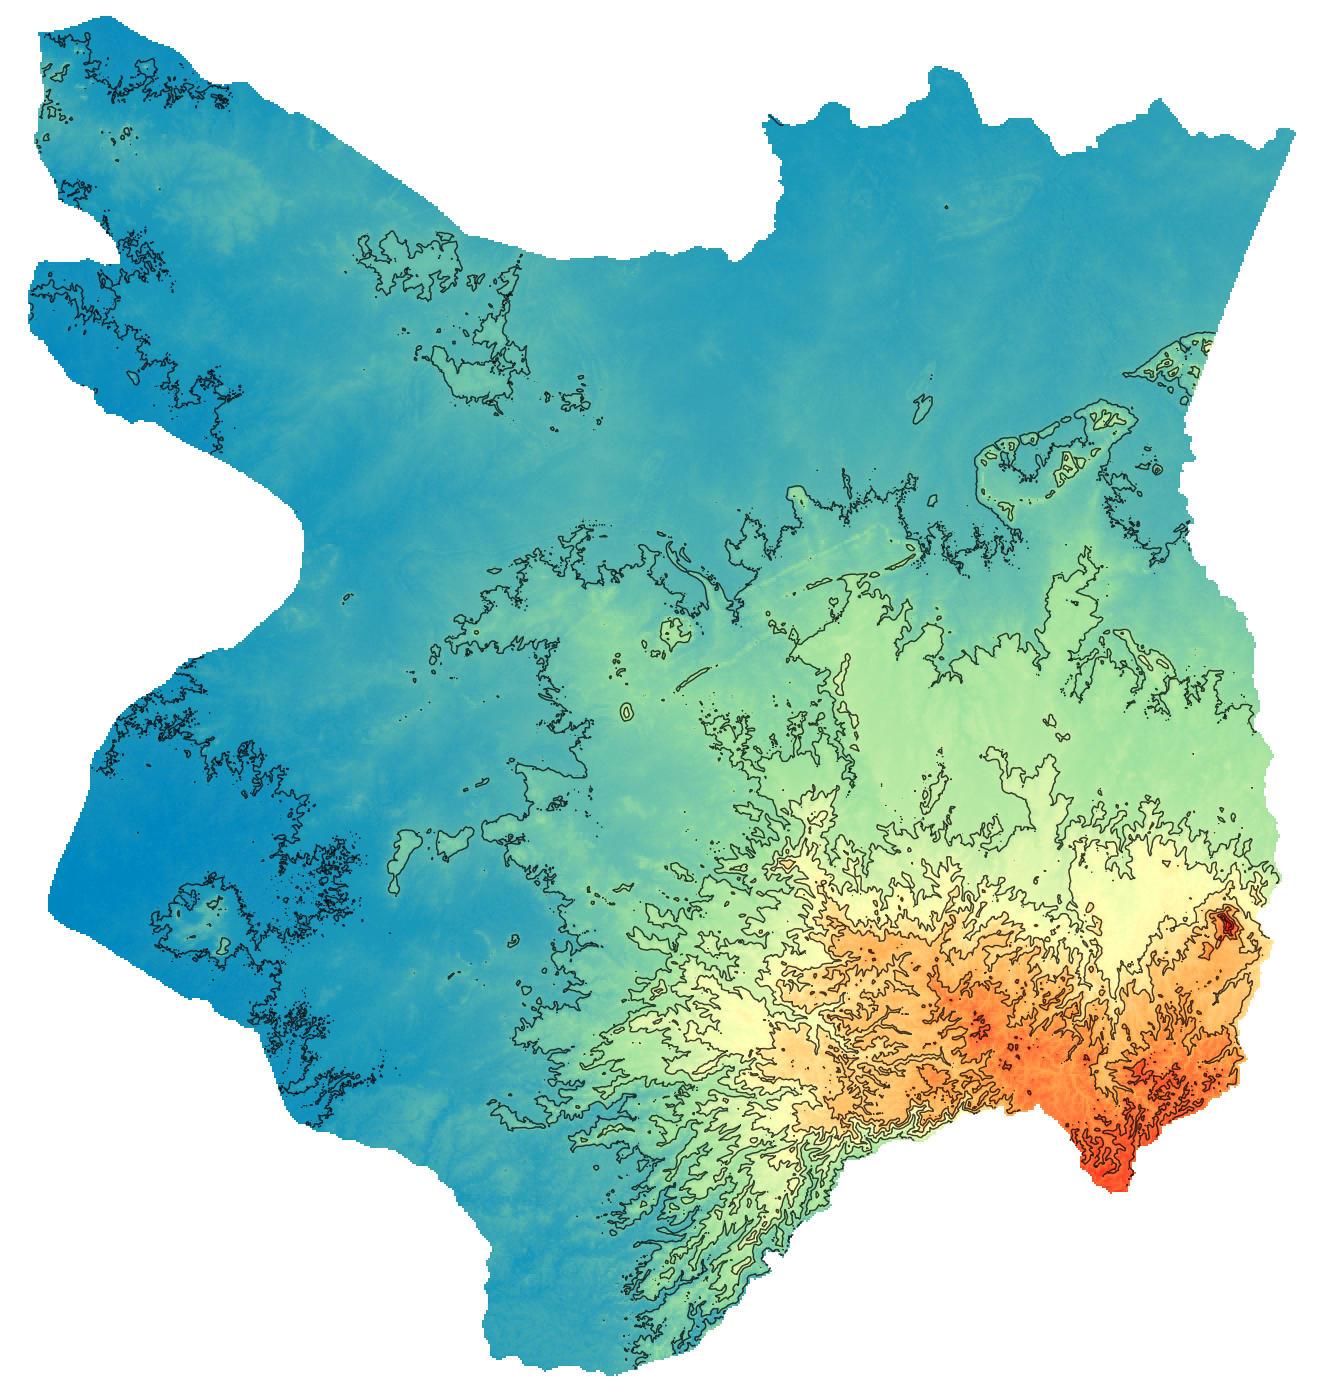
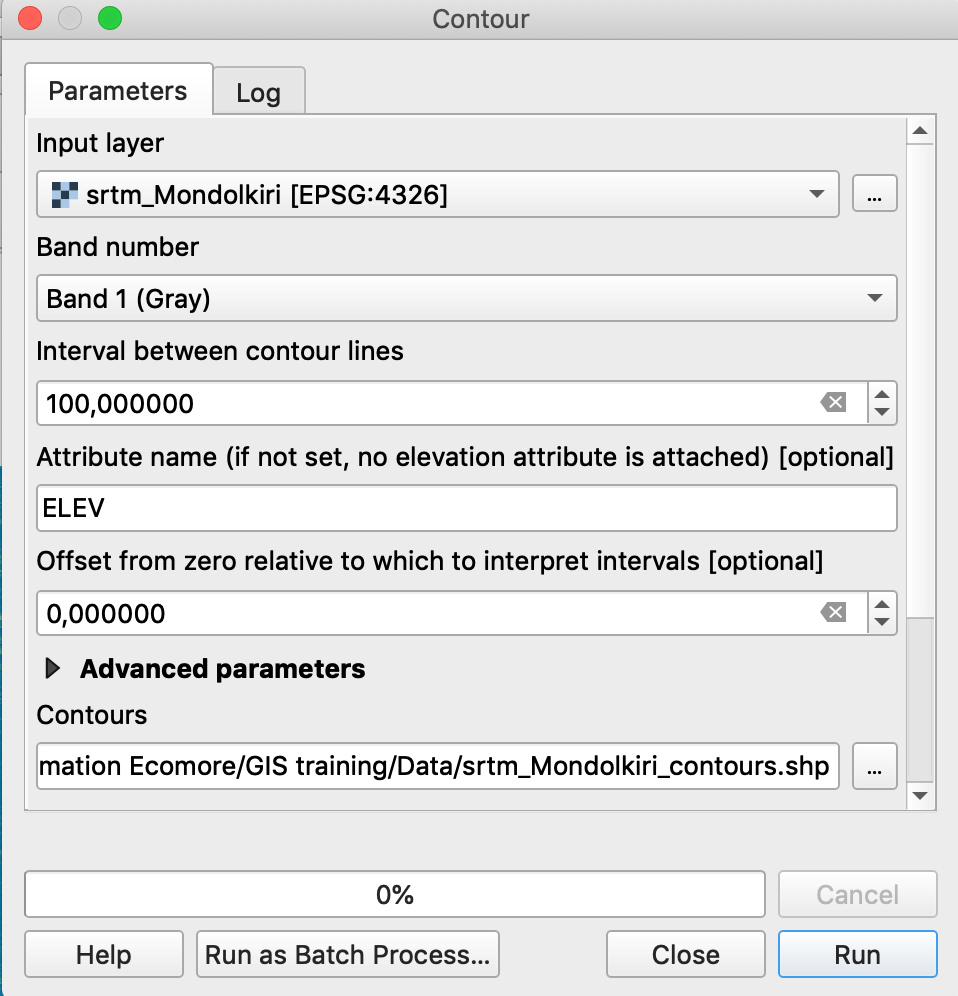
Exercise: Calculate the contour lines of Mondolkiri province
- Go to Raster Menu / Extraction / Contour…
- Choose the Mondolkiri DEM
- Choose the interval between lines = 100 meters
- Browse to your folder and give a name to the shapefile of contour lines
- Run
4.5 Raster calculator
The raster calculator allows you to make calculations between several rasters or on the values of a single raster.
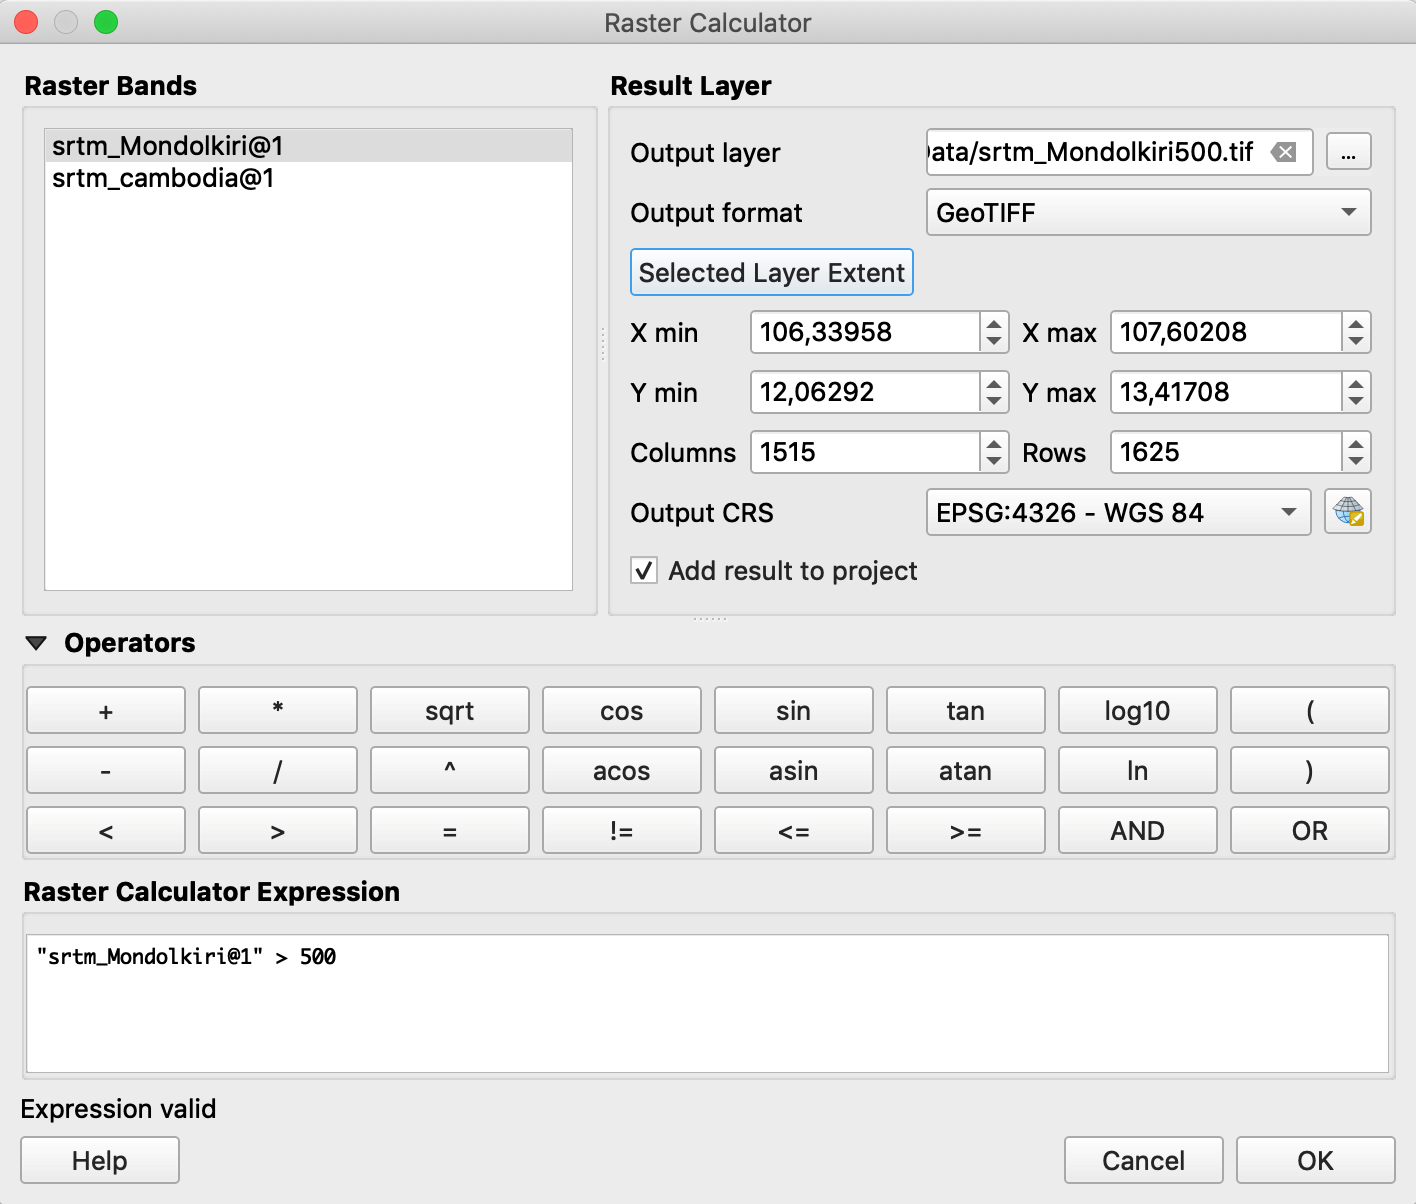
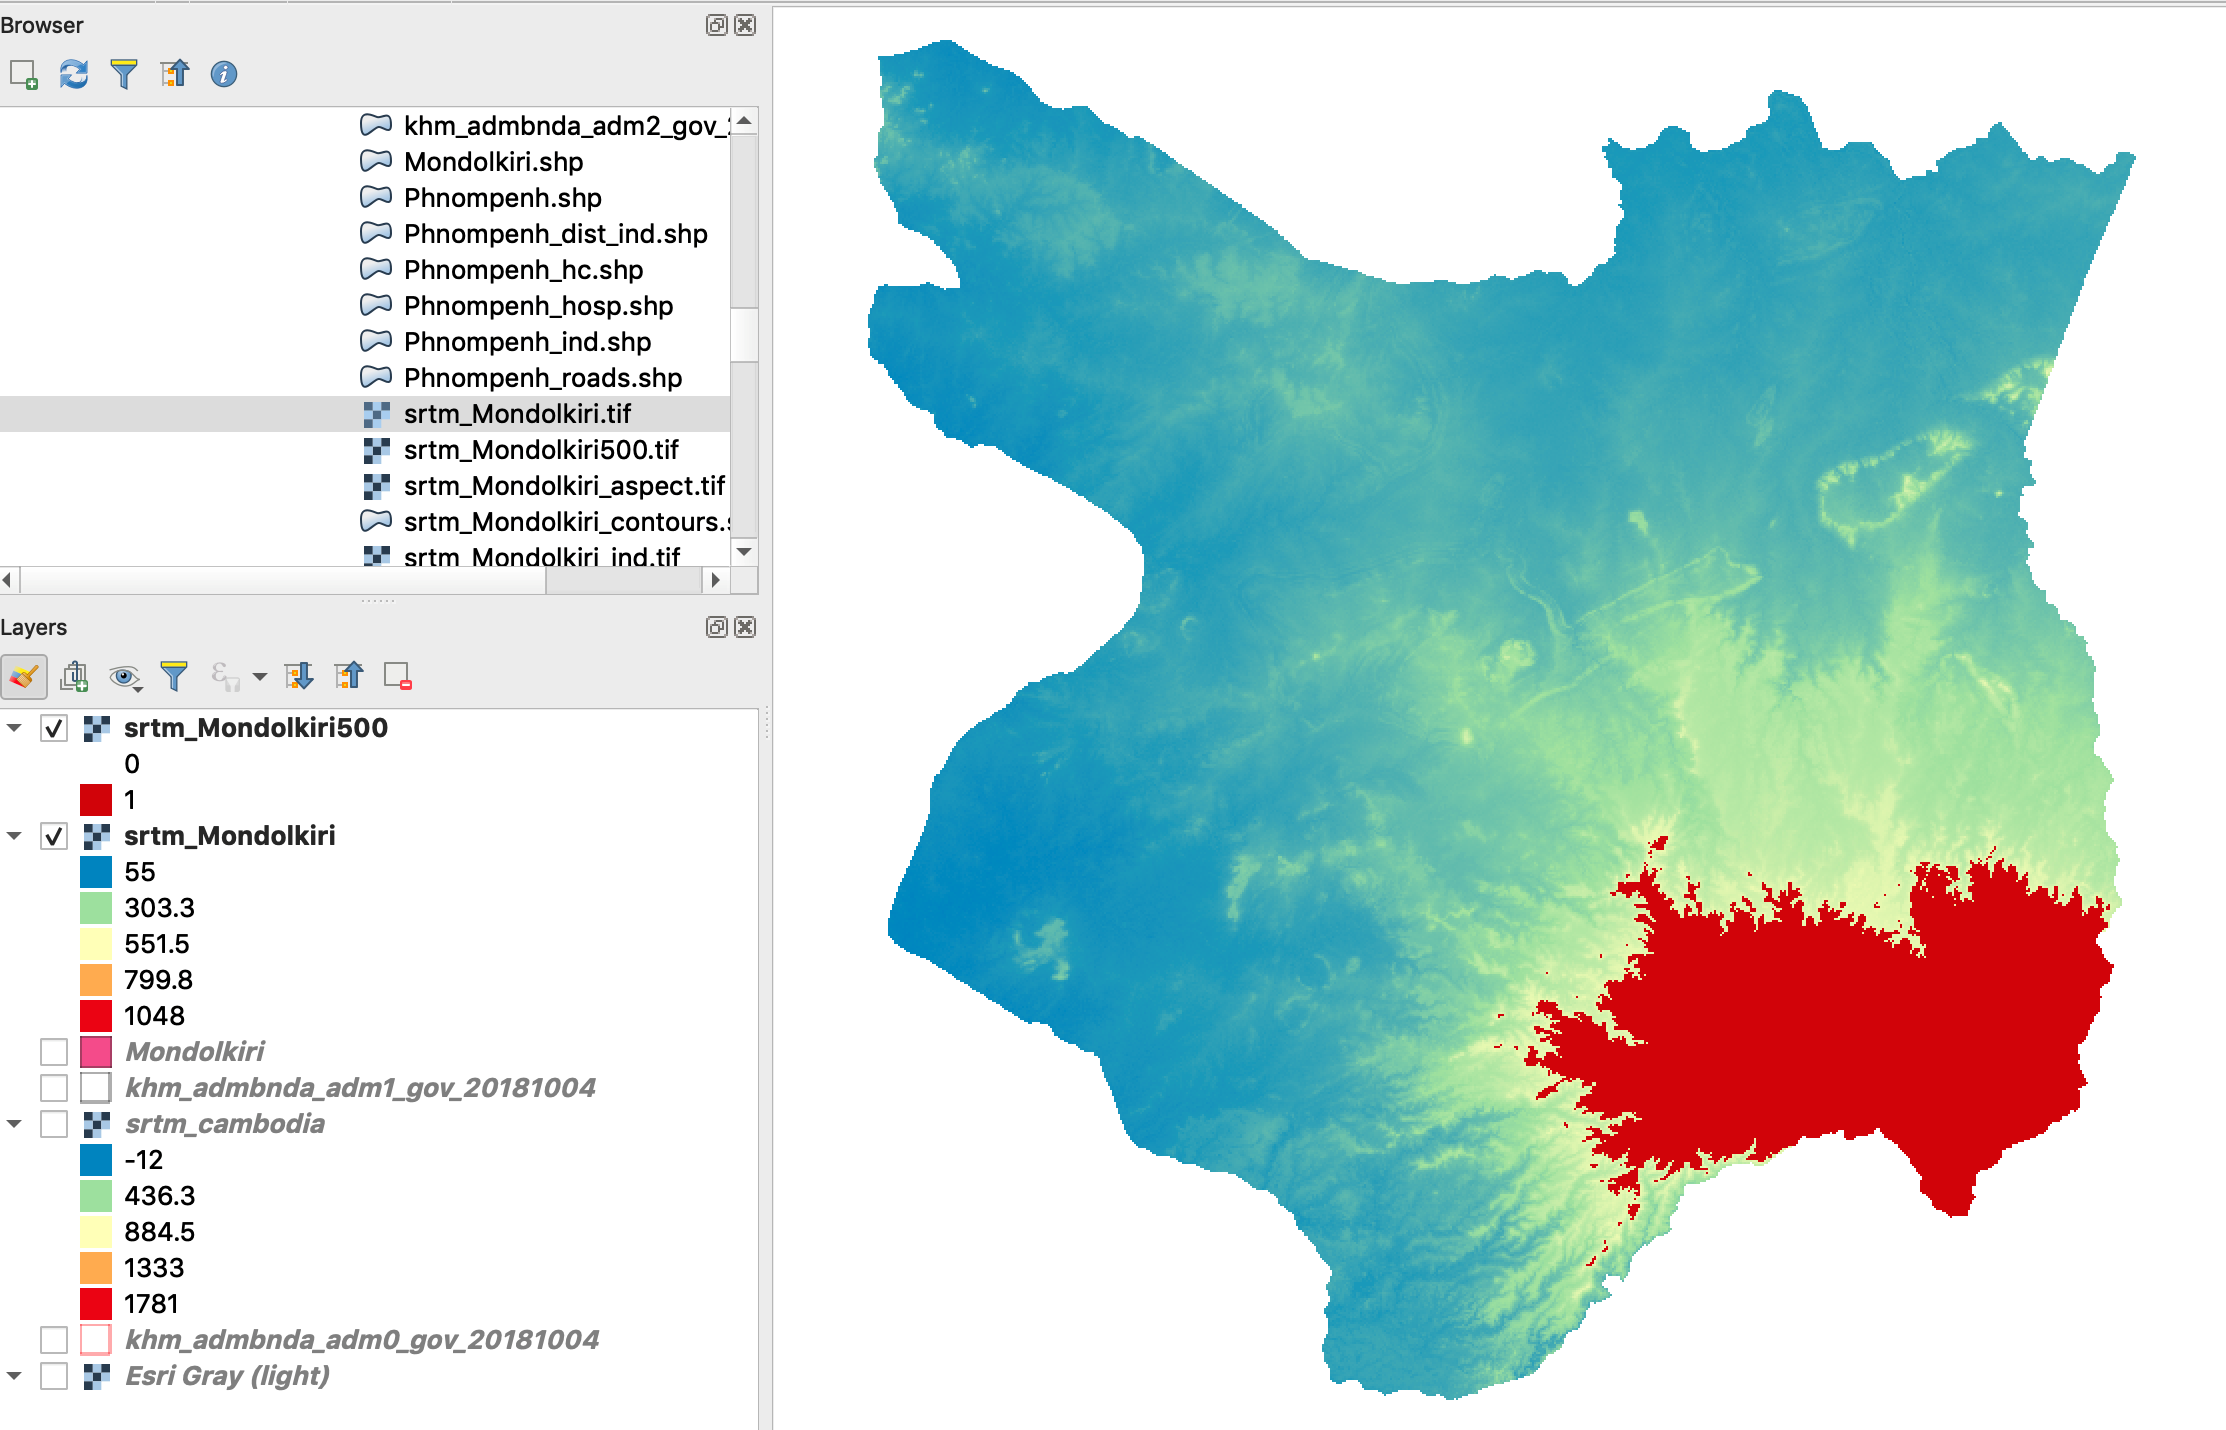
Exercise: extract the DEM over 500 meters high
- Open the raster calculator: Raster / Raster calculator…
- Select the Mondolkiri raster
- Browse to your folder and give a name for the output layer
- Raster Calculator Expression: Double-click the raster name in the “Raster Bands” list to enter its name in the expression then write “> 500”
- OK
4.6 Downloading and using Sentinel-2 images
Browse and download Sentinel-2 images
We will use here the EO Browser provided by Sentinel Hub and developed by Sinergise:
https://apps.sentinel-hub.com/eo-browser/
Exercise: download and display a Sentinel-2 image from Phnom Penh
- Open the EO Browser and search for Phnom Penh in the top right search box. Zoom the map to Phnom Penh
- Choose Sentinel-2 L1C as Data source, reduce the maximum cloud coverage to 20%
- Choose a time range and search
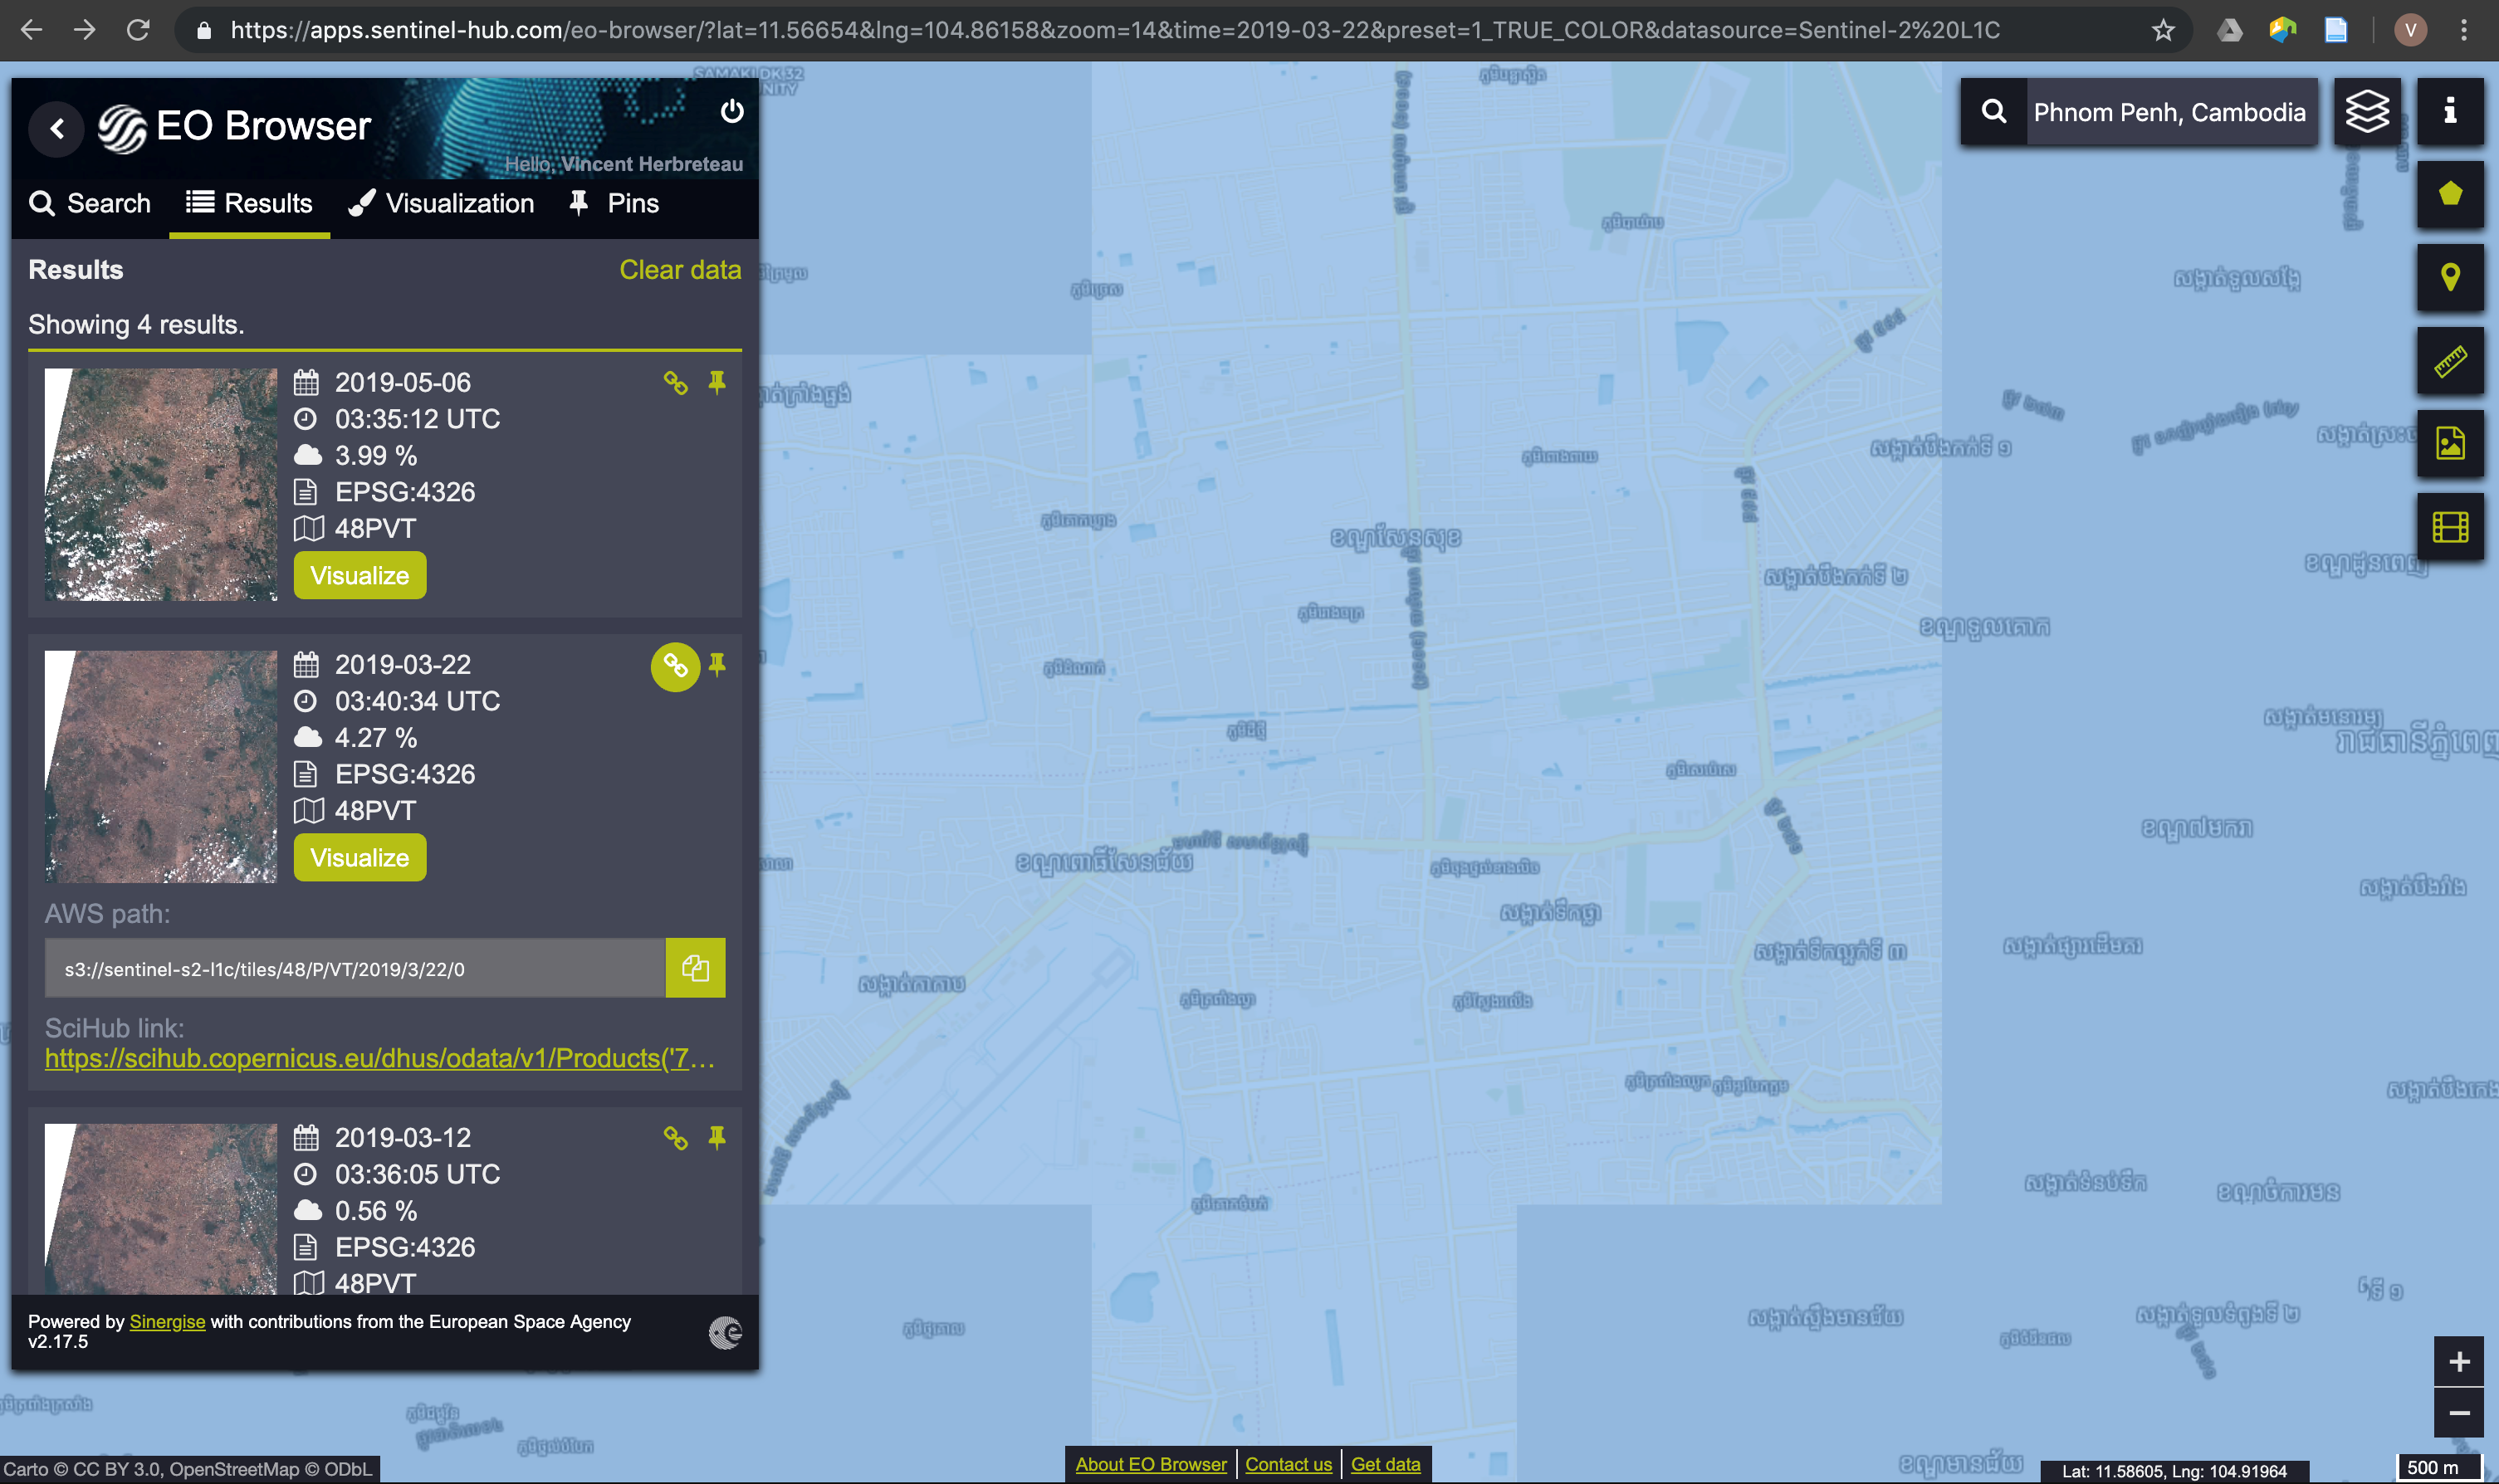
- Choose one tile among the results and click on Visualize
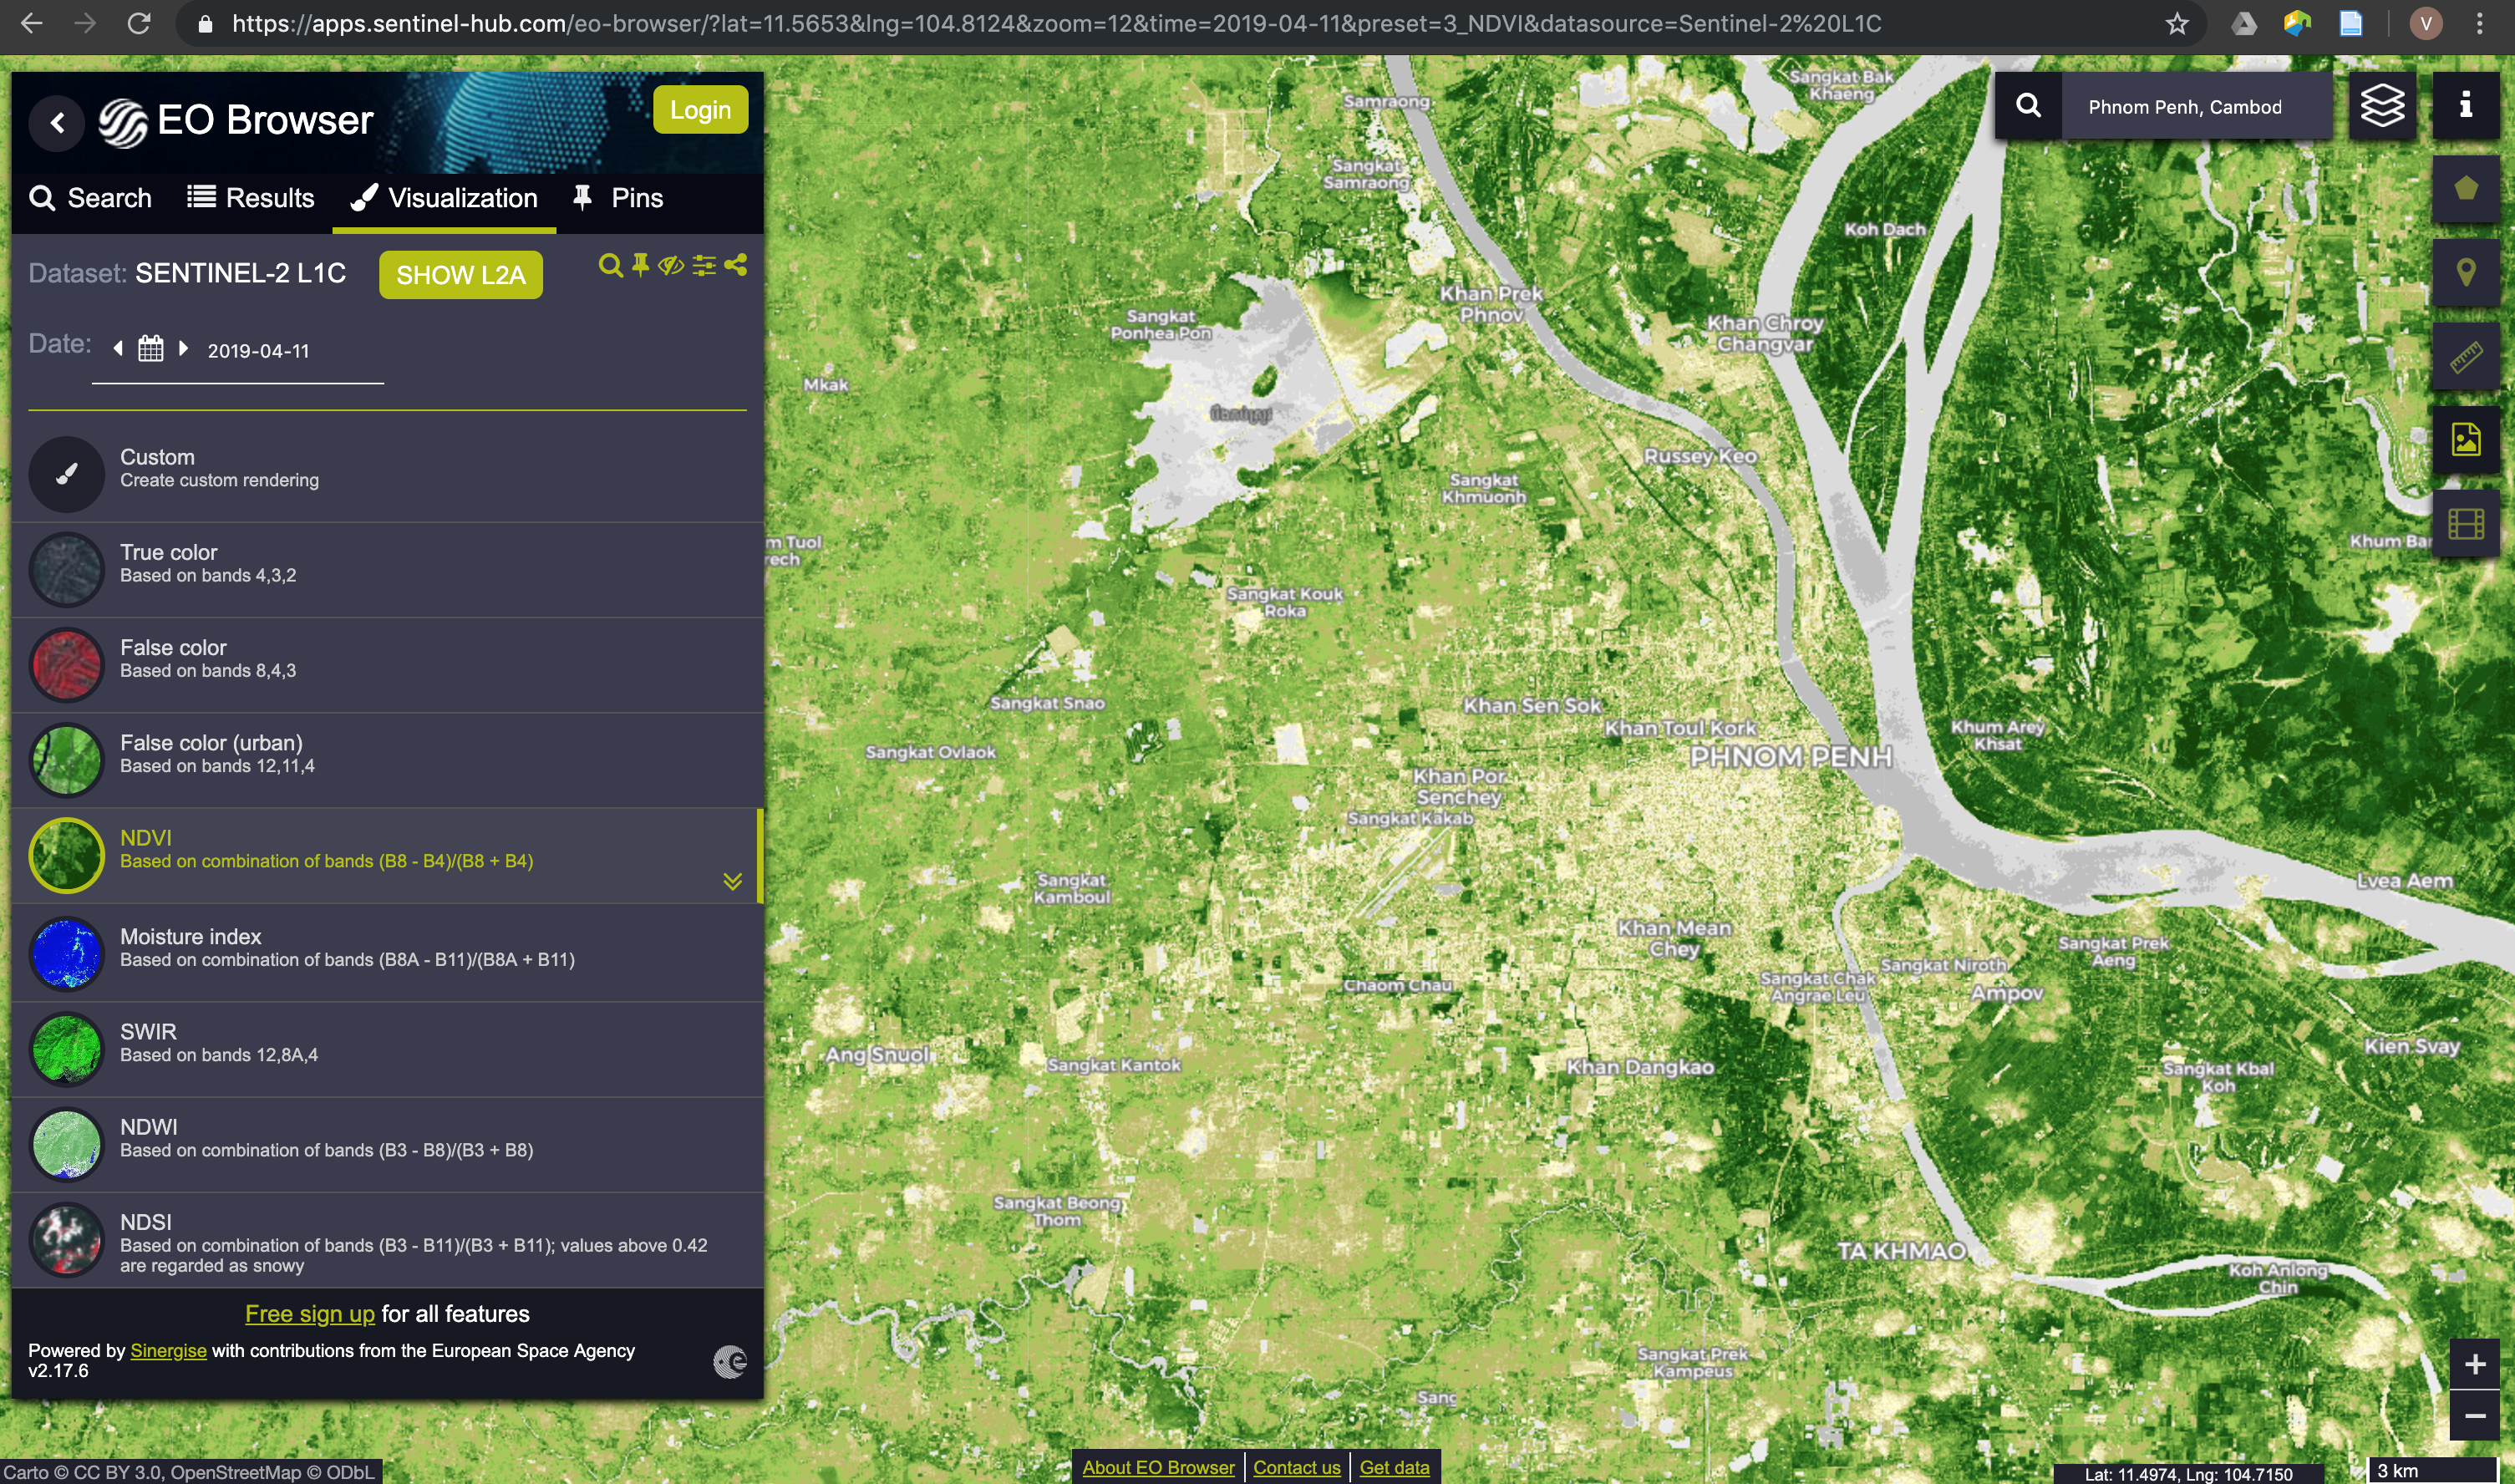
- Look at the different indices available to observe their distribution
- Click on the download icon
 to get the weblink to download the chosen image
 - Download requires to be registered in the Copernicus Open Access Hub (https://scihub.copernicus.eu/)
- Click on the download icon
Display a Sentinel-2 image in True color
- Add the raster bands of your Sentinel-2 images: Menu Layer / Add Layer / Add Raster Layer…
- Browse and choose the different bands to open B02 (Blue), B03 (Green) and B04 (Red)
- Miscellaneous / Build Virtual Raster…
- Choose the 3 input layers
- Run
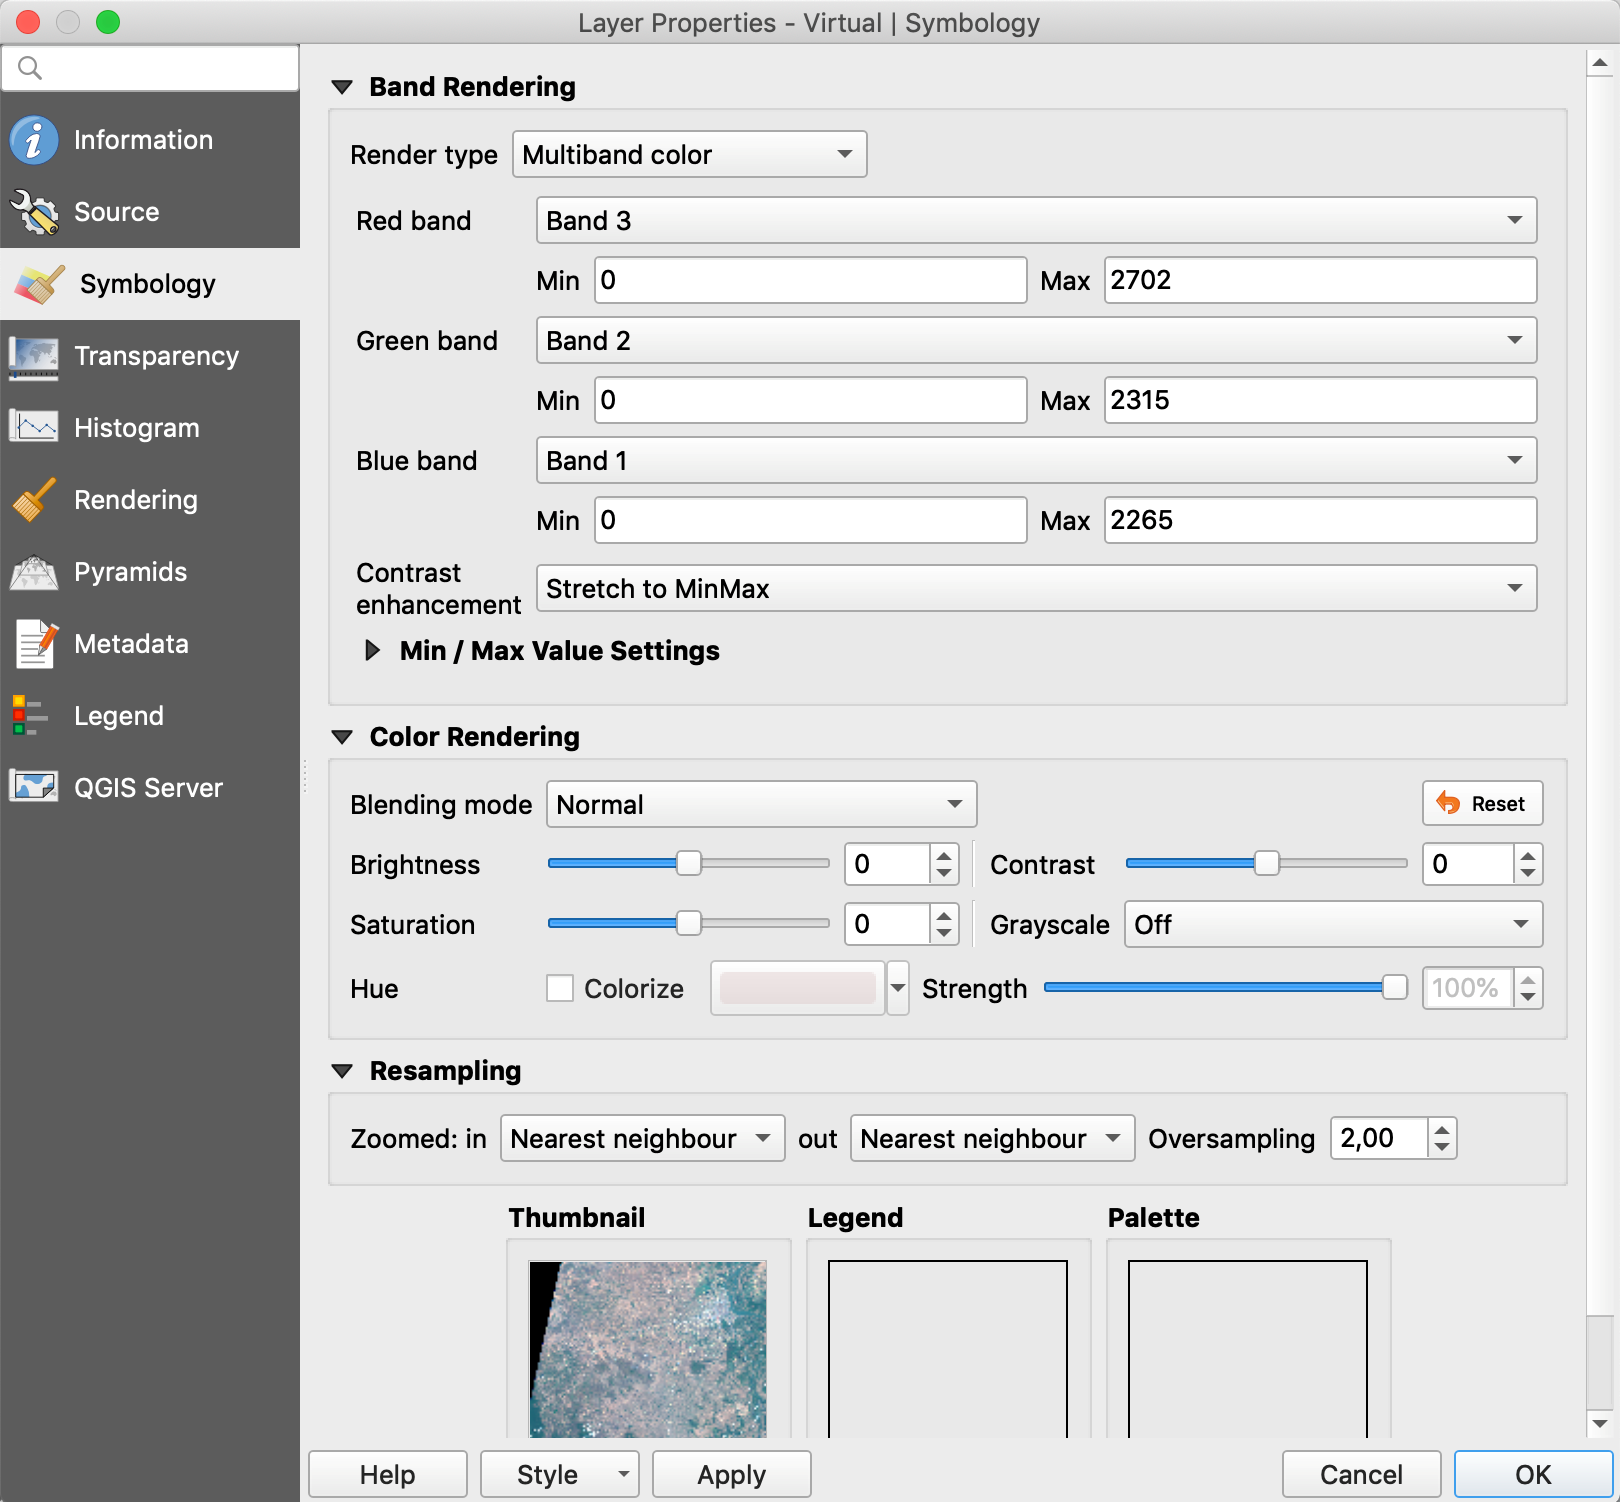
- Open the layer properties of your virtual raster and go to Symbology tab
- Choose the correct bands for each color and click OK
Exercise: Calculate the NDVI of this Sentinel-2 image from Phnom Penh
The normalized difference vegetation index (NDVI) is a simple index that can be calculated from optical satellite images to show the vigor of vegetation.
NDVI = (Near Infrared Band – Red Infrared Band) / (Near Infrared Band + Red Infrared Band)
- Go to Raster / Raster Calculator
- Browse to your folder and give a name for the NDVI
- Write the equation of NDVI
- OK
- Open the layer properties of your NDVI and go to Symbology tab
- Select Render type = Singleband pseudocolor
- Choose a Red to Green color ramp and a method of classification
- OK
